
NOTICE OF THE 2015ANNUAL MEETINGANDPROXY STATEMENT

![]()
Notice of the 2017
Annual Meeting and
Proxy Statement
To the Stockholders:
We will hold our 20152017 annual meeting of stockholders at 9:00 a.m. on Monday, May 11, 20158, 2017 at the Hyatt Regency Hotel, 1800 East Putnam Avenue, Old Greenwich, Connecticut 06870. The Notice of Meeting and Proxy Statement and accompanying proxy card describe in detail the matters to be acted upon at the meeting.
It is important that your shares be represented at the meeting. Whether or not you plan to attend, please submit a proxy through one of the three convenient methods described in this proxy statement in order for your shares to be voted at the meeting. Your vote is important so please act at your first opportunity.
We have elected to furnish proxy materials and the Annual Report to Stockholders, including the Report on Form 10-K for the year ended December 31, 20142016, to many of our stockholders via the Internet pursuant to Securities and Exchange Commission rules. We urge you to review those materials as well as our proxy statement for information on our financial results and business operations over the past year. The Internet availability of our proxy materials affords us an opportunity to reduce costs while providing stockholders the information they need. On or about March 27, 2015,24, 2017, we started mailing to many of our stockholders a Notice of Internet Availability of Proxy Materials containing instructions on how to access our proxy statement and annual report and how to submit a proxy online along with instructions on how to receive a printed copy of the proxy statement and annual report. We provided a copy of the annual meeting materials to all other stockholders by mail or through electronic delivery.
If you receive your annual meeting materials by mail, the Notice of Meeting and Proxy Statement, Annual Report to Stockholders, including the Report on Form 10-K for the year ended December 31, 20142016 and proxy card are enclosed. Whether or not you plan to attend the annual meeting in person, please mark, sign, date and return your proxy card in the enclosed prepaid envelope, or submit your proxy via telephone or the Internet, as soon as possible in order for your shares to be voted at the meeting. If you decide to attend the annual meeting and wish to change your vote, you may do so by submitting a later dated proxy or by voting in person at the annual meeting. If you received your annual meeting materials via e-mail, the e-mail contains voting instructions and links to the proxy statement and annual report on the Internet, which are also available atwww.proxyvote.com.
We look forward to seeing you at the meeting.

Michael I. Roth
Non-Executive Chairman of the Board
Stamford, Connecticut
March 27, 201524, 2017
Notice of Meeting:
Annual Meeting Information
The annual meeting of stockholders of Pitney Bowes Inc. will be held on Monday, May 11, 2015, at 9:00 a.m. at the Hyatt Regency Hotel, 1800 East Putnam Avenue, Old Greenwich, Connecticut 06870.
| Time and Date: | Monday, May 8, 2017 at 9:00 a.m. |
| Place: | Hyatt Regency Hotel, 1800 East Putnam Avenue, Old Greenwich, Connecticut 06870 |
| Requirements for Attendingthe Meeting: | Admission ticket, which is attached to your proxy card, or Notice of Internet Availability of Proxy Materials, together with a form of valid, government-issued photo identification, such as a driver’s license. If your shares are held in the name of a bank, broker or nominee, you must present proof of your ownership as of the record date (such as bank or brokerage account statement). |
| Record Date: | March 10, 2017 |
| Voting: | Registered stockholders as of the record date (March 10, 2017) are entitled to submit proxies by Internet atwww.proxyvote.com; telephone at 1-800-690-6903; or completing your proxy card; or you may vote in person at the annual meeting. If you hold your shares through a broker, bank, trustee or other nominee, you are a beneficial owner and should refer to instructions provided by that entity on voting methods. |
Important Notice Regarding the Availability of Proxy Materials for the Stockholders Meeting to be held on May 11, 2015:8, 2017:
Pitney Bowes’ 20152017 Proxy Statement and Annual Report to Stockholders, including the Report on Form 10-K for the year ended December 31, 2014,2016, are available atwww.proxyvote.com.
The items of business at the annual meeting are:
| 1. | Election of | ||
| 2. | Ratification of the Audit Committee’s Appointment of the Independent Accountants for | ||
| 3. | Non-binding Advisory Vote to Approve Executive Compensation. | ||
| 4. | Non-binding Advisory Vote on the Frequency of Future Advisory Votes to Approve Executive Compensation. |
Stockholders also will act on such other matters as may properly come before the meeting, including any adjournment or postponement of the meeting.
March 13, 201510, 2017 is the record date for the meeting.
This proxy statement and accompanying proxy card are first being distributed or made available via the Internet beginning on or about March 27, 2015.24, 2017.
Amy C. Corn
Daniel J. Goldstein
Executive Vice President, Chief Legal Officer & Corporate Secretary
��
| NOTICE: Your vote is important. Brokers arenot permitted to vote on |
TABLE OF CONTENTS
| 3 |
| 4 |

In this summary we highlight certain information contained elsewhere in this proxy statement. This is only a summary and does not contain all the information you should consider before you submit your proxy or vote. Please read the complete proxy statement and Annual Report on Form 10-K before you submit your proxy or vote.
Annual Meeting Information
Governance Structure and Leadership Roles
The board reappointed Michael Roth, an independent member of the board of directors, to serve as Non-Executive Chairman of the Board in May 2014. A description of the Chairman role appears in the Board of Directors Governance Principles, which can be found on the company’s website atwww.pitneybowes.com under the caption “Our Company—Leadership & Governance—Corporate Governance.”
2014 Summary of Business Performance
In 2014, Pitney Bowes achieved significant progress against its three strategic initiatives to transform the company and unlock shareholder value by 1) stabilizing the mail business, 2) driving operational excellence, and 3) growing its business through expansion in digital commerce. During the year, the company continued its implementation of a new go-to-market strategy, divested certain business operations, and initiated a global effort to streamline the company’s back-office systems. All aspects of the company’s Digital Commerce Solutions segment grew revenue in 2014, including the introduction of outbound eCommerce services from the United Kingdom.
In addition, the company continued to deliver innovative physical and digital products and solutions and made significant investments in marketing in support of the transformation of our brand. One of the main goals of the re-branding effort is to update the market’s perception of the company. This is the first brand refresh since 1971 and only the third in the company’s 95 year history.
From a financial perspective:
PROXY SUMMARY
In short, 2014 was a year of significant progress for Pitney Bowes. We continue to see positive trends in our businesses and are making material progress toward unlocking the long-term value embedded in our company. For additional detail on the calculation of the financial metrics described above please refer to page 55 “Non-GAAP Measures” and corresponding table.
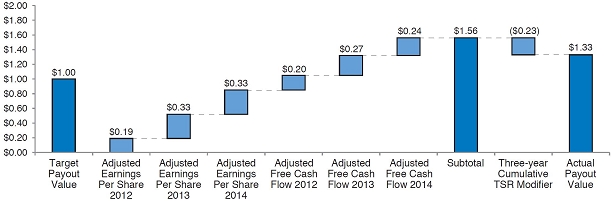
2014 Summary of Compensation Payouts
Based on the 2014 financial results summarized above when compared against the pre-determined financial goals as shown in the table below, the annual incentive payout multiplier for the named executive officers (NEOs) was 125.1% and the long-term 2012-2014 cash incentive unit award payout was $1.33 per unit.
 | ||
We urge stockholders to read our Annual Report on Form 10-K for the year ended December 31, 2014, filed with the Securities and Exchange Commission (SEC) on February 20, 2015, which describes our business and 2014 financial results in more detail.
PROXY SUMMARY
2014 Summary of Executive Compensation Changes
At the annual meeting in 2014, stockholders voted in favor of our executive compensation (Say-on-Pay) by over 95% of votes cast. The vote reflected stockholder approval of our compensation philosophy and pay actions as approved by the Committee in 2014 and prior years. In 2014, these actions included:
The 2014 changes noted above were in addition to the significant changes made to the executive compensation program during the last two years, including the following:
2014 CEO Compensation Actions
The following are highlights of 2014 compensation actions taken for the President and CEO as approved by the board of directors:
Direct Compensation Components and Mix
The overwhelming majority, 86%, of our CEO’s target total direct compensation, and 71% of target total direct compensation for the other executive officers, is variable, and is subject to financial performance metrics. In addition, more than two-thirds of the total compensation paid to our CEO, and half of the total compensation paid to the NEOs, is equity-based and aligned with shareholder interests.

PROXY SUMMARY
Meeting Agenda Items
Proposal 1: Election of Directors
You are being asked to elect 10 directors.eleven directors, which constitute the entire board. Each of the director nominees is standing for election to a one-year term ending at the next annual meeting of stockholders in 20162018 and until his or her successor has been duly elected and qualified.
All current directors attended overat least 75% of the meetings of the board and board committees on which they served in 2014.2016.
Summary Information about our Director NomineesThe board of directors recommends that stockholders vote FOR the election of all the director nominees.
| Director Nominee | Age | Director Since | Occupation | Independent | Committees | Other Public Boards | |||||||
| Linda G. Alvarado | 63 | 1992 | President and CEO, Alvarado Construction, Inc. | X | •Finance •Governance | 3M Company | |||||||
| Anne M. Busquet | 65 | 2007 | Principal, AMB Advisors, LLC | X | •Executive Compensation •Governance | Medical Transcription Billing Corp., InterContinental Hotels Group PLC | |||||||
| Roger Fradin | 61 | 2012 | Vice Chairman, Honeywell International Inc. | X | •Audit •Finance | MSC Industrial Direct Co., Inc. | |||||||
| Anne Sutherland Fuchs | 67 | 2005 | Consultant to private equity firms | X | •Audit •Executive Compensation | Gartner, Inc. | |||||||
| S. Douglas Hutcheson | 58 | 2012 | CEO, Laser, Inc. | X | •Audit •Finance | InterDigital, Inc. | |||||||
| Marc B. Lautenbach | 53 | 2012 | President and CEO, Pitney Bowes Inc. | X | •Executive | Campbell Soup Company | |||||||
| Eduardo R. Menascé | 69 | 2001 | Co-Chairman, The Taylor Companies | •Executive •Executive Compensation** •Governance | John Wiley & Sons Inc., Hill-Rom Holdings, Inc., Hillenbrand, Inc. | ||||||||
| Michael I. Roth* | 69 | 1995 | Chairman and CEO, The Interpublic Group of Companies, Inc. | X | •Audit •Executive** •Finance** | Ryman Hospitality Properties Inc., The Interpublic Group of Companies, Inc. | |||||||
| David L. Shedlarz | 66 | 2001 | Retired Vice Chairman, Pfizer Inc. | X | •Audit** •Executive •Finance | Teachers Insurance and Annuity Association, TheHershey Company | |||||||
| David B. Snow, Jr. | 60 | 2006 | Chairman and CEO, Cedar Gate Technologies, Inc. | X | •Executive •Executive Compensation •Governance** | — |
PROXY SUMMARY
Proposal 2: Ratification of the Audit Committee’s Appointment of the Independent Accountants for 20152017
The board is asking stockholders to ratify the selection of PricewaterhouseCoopers LLP as our independent accountants for 2015.2017.
The board of directors recommends that stockholders vote FOR the ratification of PricewaterhouseCoopers LLP as our independent accountants for 2017.
Proposal 3: Non-binding Advisory Vote to Approve Executive Compensation
The board is asking stockholders to approve, on ana non-binding advisory basis, the compensation of the named executive officers as disclosed in this proxy statement. The board has determined to hold this advisory vote on an annual basis. The next advisory vote will beis expected to take place at the 20162018 annual meeting of stockholders.
The board of directors recommends that stockholders vote FOR the approval of executive compensation on an advisory basis.
Proposal 4: Non-binding Advisory Vote on the Frequency of Future Advisory Votes to Approve Executive Compensation
The board is asking stockholders to approve, on an advisory basis, that the advisory vote to approve executive compensation occurs every year.
The board of directors recommends that stockholders vote to conduct future advisory votes to approve executive compensation EVERY YEAR.


Our board of directors is soliciting proxies to be used at the annual meeting of stockholders to be held on May 11, 2015,8, 2017, at 9:00 a.m. at the Hyatt Regency Hotel, 1800 East Putnam Avenue, Old Greenwich, Connecticut 06870, and at any adjournment or postponement of the meeting. This proxy statement contains information about the items being voted on at the annual meeting.
An admission ticket, which is required for entry into the annual meeting, is attached to your proxy card if you hold shares directly in your name as a registered stockholder. If you plan to attend the annual meeting, please submit your proxy but keep the admission ticket and bring it to the annual meeting.
If your shares are held in the name of a bank, broker or nominee and you plan to attend the meeting, you must present proof of your ownership of Pitney Bowes stock as of the record date (such as a bank or brokerage account statement) to be admitted to the meeting.
If you have received a Notice of Internet Availability of Proxy Materials (a “Notice”), your Notice is your admission ticket. If you plan to attend the annual meeting, please submit your proxy, but keep the Notice and bring it to the annual meeting.
Stockholders also must present a form of photo identification, such as a driver’s license, in order to be admitted to the annual meeting.No cameras, recording equipment, large bags, or packages will be permitted in the annual meeting. Many cellular phones have built-in cameras, and, while these phones may be brought into the annual meeting, the camera function may not be used at any time.
Each stockholder may appoint only one proxy holder or representative to attend the meeting on his, her or herits behalf.
Who is entitled to vote?Outstanding Shares and Vote Entitlement
Record stockholdersEach share of Pitney Bowes common stock has one vote. In addition, we have two classes of preferred stock issued and outstanding: the 4% Preferred Stock and the $2.12 convertiblePreference Stock. The 4% Preferred Stock can be converted into 24.24 shares of common stock in certain events but does not carry any voting rights. As of March 10, 2017 (the record date), there were 12 shares of the 4% Preference Stock outstanding. The $2.12 Preference Stock can be converted into 16.53 shares of common stock in certain events and each share of the $2.12 Preference Stock carries with it 16.53 votes. Record holders of the common stock and the preference stock at the close of business on March 13, 2015 (thethe record date)date of March10, 2017 can vote at the meeting. As of the record date, 201,666,157186,280,109 shares of Pitney Bowes common stock, and 20,05617,645 shares of the $2.12 convertible preference stockPreference Stock were issued and outstanding. Each stockholder has one vote for each share of common stock owned as of the record date, and 16.53 votes for each share of $2.12 convertible preference stock owned as of the record date.
If you are a registered stockholder which means you hold shares in your name, you may choose one of three methods to grantsubmit your proxy to have your shares voted:
| • | you may | |
| • | you may | |
| • | if you received your annual meeting material by mail, you also may choose to grant your proxy by completing and mailing the proxy card. |
Alternatively, you may attend the meeting and vote in person.
If you hold your shares through a broker, bank, trustee or other nominee, you are a beneficial owner and should refer to instructions provided by that entity on voting methods. Please note that if you are a beneficial owner and you wish to vote in person at the meeting, you must first obtain a legal proxy issued in your name from the broker, bank, trustee or other nominee that holds your shares.
May I revoke my proxy or change my vote?
If you are a registered stockholder, you may revoke your proxy or change your vote at any time before your proxy is voted at the meeting by any of the following methods:
| • | you may send in a revised proxy dated later than the first proxy; | |
| • | you may vote in person at the meeting; or | |
| • | you may notify the corporate secretary in writing prior to the meeting that you have revoked your proxy. |
Attendance at the meeting alone will not revoke your proxy.
If you hold your shares through a broker, bank, trustee or other nominee, you are a beneficial owner and should refer to instructions provided by that entity on how to revoke your proxy or change your vote.
The holders of shares representing a majority of the votes entitled to be cast at the annual meeting constitutes a quorum. If you submit your proxy by Internet, telephone or proxy card, you will be considered part of the quorum. Abstentions and broker non-votes are included in the count to determine a quorum.
What vote is required for a proposal to pass?
If a quorum is present, director candidates receiving the affirmative vote of a majority of votes cast will be elected. Proposals 2, 3 and 34 will be approved if a quorum is present and a majority of the votes cast by the stockholders are voted for the proposal.
GENERAL INFORMATION
Your broker is not permitted to vote on your behalf on any proposals to be considered at the meeting including the election of directors and the advisory vote to approve executive compensation, except on proposal 2, the ratification of the selection of PricewaterhouseCoopers LLP as independent accountants for 2015,2017, unless you provide specific instructions by completing and returning the voting instruction form or following the instructions provided to you to vote your stock via telephone or the Internet. If you do not own your shares of record, for your vote to be counted with respect to proposals 1, 3 or 3,4, you will need to communicate your voting decisions to your broker, bank, financial institution or other nominee.
Under New York Stock Exchange rules, if your broker holds your shares in its “street” name, the broker may vote your shares in its discretion on proposal 2 if it does not receive instructions from you.
If your brokerdoes nothave discretionary voting authority and you do not provide voting instructions, or if you abstain on one or more agenda items, the effect would be as follows:
Proposal 1: Election of Directors
Broker non-votes and abstentions would not be votes cast and therefore would not be counted either for or against. As a result, broker non-votes and abstentions will have no effect in the election of directors.
Proposal 2: Ratification of Audit Committee’s Appointment of the Independent Accountants for 20152016
If you choose to abstain in the ratification of the Audit Committee’s selection of the independent accountants for 2015,2017, the abstention will have no effect.effect on the ratification of the Audit Committee’s selection of the independent accountants for 2017.
Proposal 3: Non-binding Advisory Vote to Approve Executive Compensation
The vote to approve executive compensation is an advisory vote and the results will not be binding on the board of directors or the company.Company. The board of directors will review the results and take them into consideration when making future decisions regarding executive compensation. Broker non-votes and abstentions would not be votes cast and therefore would not be counted either for or against. As a result, broker non-votes and abstentions will have no effect on the advisory vote to approve executive compensation.
Proposal 4: Non-binding Advisory Vote on the Frequency of Future Advisory Votes to Approve Executive Compensation
The vote on the frequency of the vote to approve executive compensation is an advisory vote and the results will not be binding on the board of directors or the Company. The board of directors will review the results and take them into consideration when making future decisions regarding executive compensation. Broker non-votes and abstentions would not be votes cast and therefore would not be counted either for or against. As a result, broker non-votes and abstentions would have no effect on this proposal.
How do Dividend Reinvestment Plan participants or employees with shares in the 401(k) plans vote by proxy?
If you are a registered stockholder and participate in our Dividend Reinvestment Plan, or our employee 401(k) plans, your proxy includes the number of shares acquired through the Dividend Reinvestment Plan and/or credited to your 401(k) plan account.
Shares held in our 401(k) plans are voted by the plan trustee in accordance with voting instructions received from plan participants. The plans direct the trustee to vote shares for which no instructions are received in the same proportion (for, against or abstain) indicated by the voting instructions given by participants in the plans.
Broadridge Financial Solutions, Inc. (Broadridge) will tabulate the votes and act as Inspector of Election.
Want more copies of the proxy statement? Getting too many copies?
Only one Notice or, if paper copies are requested, only one proxy statement and annual report to stockholders including the report on Form 10-K are delivered to multiple stockholders sharing an address unless one or more of the stockholders give us contrary instructions. You may request to receive a separate copy of these materials, either now or in the future, and we will promptly deliver the requested materials.
Similarly, any stockholder currently sharing an address with another stockholder but nonetheless receiving separate copies of the materials may request delivery of a single copy in the future.
Requests can be made to:
Broadridge Householding Department by phone at 1-800-542-10611-866-540-7095 or by mail to:
Broadridge Householding Department
51 Mercedes Way
Edgewood, New York 11717.
If you own shares of stock through a bank, broker, trustee or other nominee and receive more than one copy of the materials, please contact that entity to eliminate duplicate mailings.
Additional copies of our annual report to stockholders, including the report on Form 10-K or the proxy statement will be sent to stockholders free of charge upon written request to:
Investor Relations, Pitney Bowes Inc.
3001 Summer Street
Stamford, CT 06926-0700.
Want Electronic Delivery of the Annual Report and Proxy Statement?
We want to communicate with you in the way you prefer. You may receive:
| 7 |
GENERAL INFORMATION
| • | a Notice of Internet Availability of Proxy Materials or a full set of printed materials, including the proxy statement, annual report and proxy card; or | |
| • | an email with instructions for how to view the annual meeting materials and vote online. |
If you received the Notice of Internet Availability of Proxy Materials or a full set of annual meeting materials by mail, you may choose to receive future annual meeting materials electronically by following the instructions when you vote online or by telephone. With electronic delivery, you will receive an e-mail for future meetings listing the website locations of these documents and your choice to receive annual meeting materials electronically will remain in effect until you notify us that you wish to resume mail delivery of these documents. If you hold your Pitney Bowes stock through a bank, broker, trustee or other nominee, you should refer to the information provided by that entity for instructions on how to elect this option. This proxy statement and our 20142016 annual report may be viewed online atwww.proxyvote.com.
GENERAL INFORMATION
Stockholder Proposals and Other Business for the 20162018 Annual Meeting
If a stockholder wants to submit a proposal for inclusion in our proxy material for the 20162018 annual meeting, which is scheduled to be held on Monday, May 9, 2016,7, 2018, it must be received by the corporate secretaryCorporate Secretary by the close of business on November 28, 2015.24, 2017. Also, under our By-laws, a stockholder can present other business
at an annual meeting, including the nomination of candidates for director, only if written notice of the business or candidates is received by the corporate secretaryCorporate Secretary no earlier than the close of business on January 12, 20168, 2018 and no later than the close of business on February 11, 2016.7, 2018. However, in the event that the date of the 20162018 annual meeting is more than 30 days before or more than 60 days after the anniversary of our 20152017 annual meeting, then the stockholder’s notice must be delivered no earlier than the close of business on the 120th day prior to the meeting and no later than the close of business
on the later of the 90th day prior to the meeting or, if the first public announcement of the date of the annual meeting is less than 100 days prior to the date of such meeting, the 10th day after the first public announcement of the meeting date. There are other procedural requirements in the By-laws pertaining to stockholder proposals and director nominations. The By-laws are posted on our Corporate Governance website atwww.pitneybowes.com under the caption “Our Company—Our Leadership & Governance—Corporate Governance.” If notice of a matter is not received within the applicable deadlines or does not comply with the By-laws, the chairman of the meeting may refuse to introduce such matter. If a stockholder does not meet these deadlines, or does not satisfy the requirements of Rule 14a-4 of the Exchange Act, the persons named as proxies will be allowed to use their discretionary voting authority when and if the matter is raised at the annual meeting.
We encourage stockholders to visit our Corporate Governance website atwww.pitneybowes.com under the caption “Our Company—Leadership &Meet Our Leaders—Corporate Governance” for information concerning governance practices, including the Governance Principles of the Board of Directors, charters of the committees of the board, and the directors’ Code of Business Conduct and Ethics. Our Business Practices Guidelines, which is the Code of Ethics for employees, including our Chief Executive Officer (CEO) and Chief Financial Officer,our named executive officers (NEOs), is also available on our Leadershipat “Our Company—Corporate Responsibility—Values & Governance website.Ethics.” We intend to disclose any future amendments or waivers to certain provisions of the directors’ Code of Business Conduct and Ethics or the Business Practices Guidelines on our website within four business days following the date of such amendment or waiver.
Investor Outreach.It is our practice to contact many of our stockholders over the course of the year to discuss governance issues, and to seek their views on various governance topics and executive compensation matters. In the spring of 2014,2016, we reached out to holders ofstockholders representing approximately 43%49% of outstanding company shares, and in late 2014,fall 2016, we reached out to holders ofstockholders representing approximately 46%51% of outstanding company shares. We value the feedback we receive concerning the board’s leadership structure, governance practices, the company’s proxy statement, executive compensation, and emerging governance trends.and executive compensation. With those stockholders who responded to our invitation in the fall of 2016, we discussed corporate governance practices, executive compensation policies and our approach to the board’s role in risk mitigation oversight, including its oversight of our cybersecurity efforts. The stockholders were generally satisfied with our approach.
| 8 |
GENERAL INFORMATION
Key Corporate Governance Practices Enhancing the Board’s Independent
Leadership, Accountability and Oversight
| • | Separate Chairman and | |
| • | Independent | |
| • | Executive | |
| • | Majority Voting in Director | |
| • | Annual Election of | |
| • | Stock Holding | |
| • | No Hedging or |
| • | Annual Assessments.Every year, the full board, as well as each board committee, conducts a self-assessment to evaluate all aspects of the board or board committee, including the members of the board and the board’s leadership. In some years, the board engages a third party advisor for assistance in the self-assessment, and it did so in 2016. The third-party advisor provided feedback in separate discussions with the full board and the Governance Committee as well as in individual discussions with the Chairman and with the Chair of the Governance Committee. |
Effective December, 2012, theThe board of directors has separated the roles of Chairman and CEO. The board appointed Michael I. Roth, an independent director, asis our Non-Executive Chairman of the board of directors andlast reappointed him to this roleby the board for an additional one-year term in May 2014 for a term of one year.2016. The board of directors believes it should have the flexibility to establish a leadership structure that works best for the company at a particular time, and it reviews that structure from time to time, including in the context of a change in leadership. The board believes that its current leadership structure best serves the objective of effective board oversight of management at this time and allows our CEO to focus primarily on the operations and management of the company, while leveraging the experience of the Non-Executive Chairman to lead the board.
In 2012,addition to his responsibilities in chairing the meetings of the board decided that, since the responsibilitiesand of the Lead Director,Finance Committee, Mr.
Roth, is actively involved in providing guidance to the Chief Executive Officer through frequent conversations, bringing to bear his experiences as a current and former CEO of public companies and his experiences from his service on other boards. He is a member of the Audit Committee and also regularly attends the meetings of the two committees on which washe is not a member, Executive Compensation and Governance. Also, our CEO’s ability to confer with Mr. Roth in person is enhanced by Mr. Roth’s role priorproximity to his appointment
as Non-Executive Chairman, were similar in most respects to those of a Non-Executive Chairman, the election of the new CEO was an appropriate time to separate the roles of CEO and Chairman.company headquarters.
The board of directors has established well-defined responsibilities, qualifications and selection criteria with respect to the Chairman role. This information is set forth in detail in the Governance Principles of the Board of Directors, which can be found on our website atwww.pitneybowes.com under the caption “Our Company—Leadership & Governance—Meet Our Leaders—Corporate Governance.”
| 9 |
CORPORATE GOVERNANCE
Management Succession Planning
Among the board’s most important responsibilities is to oversee short and long-term succession planning and leadership development. As part of this process, the Governance Committee oversees long-term and short-term plans for CEO succession. The board of directors is responsible for evaluating the performance of the CEO and for selection of successors to that position. The criteria used when assessing the qualifications of potential CEO successors include, among others, strategic vision and leadership, operational excellence, financial management, executive officer leadership development, ability to motivate employees, and an ability to develop an effective working relationship with the board. The Governance Principles of the
Board of Directors, which are posted on the company’s website atwww.pitneybowes.comunder the caption “Our Company—Leadership &
Governance—Meet Our Leaders—Corporate Governance,” include additional information about succession planning.
In late 2012, the board used the succession planning process described above to plan for the succession from our former CEO to the hiring of our new President and CEO, Mr. Lautenbach, and to the appointment of a new Non-Executive Chairman of the board, Michael I. Roth.
Periodically, but not less than annually, the board of directors considers management’s recommendations concerning succession planning for senior management roles other than the role of CEO. As part of this process, the board reviews development plans to strengthen and supplement the skills and qualifications of internal succession candidates.
Board Composition and Board Succession Planning
The Governance Committee periodically updates and reviews the skills and types of experience that should be represented on the board of directors in light of the company’s current business needs and future strategy. The Committee then compares these desired skills and experiences to those which current board members possess to determine whether all the identified skills and experience are sufficiently represented on the board. Based upon its review, and on its discussion with the chief executive officer,CEO, the Committee may recommend to the board that additional expertise is advisable. The Committee would then develop for the board’s consideration a skillskills and experience profile to be used in identifying additional board candidates as appropriate.
Directors are elected to terms of one year. It is the board’s policy that a director may not serve on the board later than the date of the Annual Stockholders Meeting following his or her attainment of age 72. The board believes that, in planning for board succession, it is advisable to maintain a board that includes both experienced directors with extensive knowledge of the company’s businesses, as well as newer directors who can refresh the board’s collective experience and expertise as business needs require. The board, as well as each of its committees, circulates to its members on an annual basis, a performance assessment questionnaire. The results of the assessment are reviewed by the respective committees, with a view toward taking action to address issues presented. The Governance Committee assesses the contributions of each director annually, and determines the skill set required for new members joining the board. The average tenure of our board members is approximately 11 years.
Role of the Board of Directors in Risk Oversight
The board of directors is responsible for oversight of the risk assessment and risk management process. Management is responsible for risk management, including identification and mitigation planning. The company established an enterprise risk management process to identify, assess, monitor and address risks across the entire company and its business operations. The description, assessments, mitigation plan and status for
each enterprise risk are developed and monitored by management, including management “risk owners” and an oversight management risk committee.
TheBoth the Audit Committee is responsible for overseeing and reviewingthe entire board review on an ongoing basis the structure of the company’s enterprise risk management program, including the overall process by which management identifies and
CORPORATE GOVERNANCE
manages risks. Upon the recommendation of the Governance Committee, the board of directors assigns oversight responsibility for each of the enterprise-wide risks to either a specific committee of the board, or to the full board. The board and each committee, with the exception of the Executive Committee, are responsible for oversight of one or more risks. In 2016, the Audit Committee amended its Charter to formalize its oversight of the Information Technology function generally, and cybersecurity in particular. The assignments are generally made based upon the type of enterprise risk and the
linkage of the subject matter to the responsibilities of the committee as described in its charter or the nature of the enterprise risk warranting review by the full board. For example, the Finance Committee oversees risks relating to liquidity, and the Audit Committee over-
seesoversees risks relating to internal controls and the Executive Compensation Committee reviews risk analyses relating to the Company’s compensation programs. With respect to cybersecurity, members of management from multiple disciplines in the company, including Information Technology, Research and Development, Legal and Privacy and Internal Audit provide a detailed overview to the full board of the company’s efforts regarding cybersecurity. Additionally, the enterprise risks that relate to cybersecurity are presented to the Audit Committee in further detail at Audit Committee meetings.
Each enterprise risk and its related mitigation plan is reviewed by either the board of directors or the designated board committee on an annual basis. On an annual basis, the board of directors receives a report on the status of all enterprise risks and their related mitigation plans.
Management monitors the risks and determines, from time to time, whether new risks should be considered either due to changes in the external environment,
| 10 |
CORPORATE GOVERNANCE
changes in the company’s business, or for other reasons. Management also determines whether previously identified risks should be combined with new or emerging risks.
Over the course of the year, management presents to the board for discussion purposes, the company’s overall strategic plan, as well as the strategic plan for each business unit.
The board of directors conducts an annual review of the independence of each director under the New York Stock Exchange listing standards and our standards of independence, which are set forth in the Governance Principles of the Board of Directors available on our website atwww.pitneybowes.com under the caption “Our Company—Our Leadership & Governance—Corporate Governance.” In making these determinations, the board of directors considers, among other things, whether any director hasor the director’s immediate family members have had any direct or indirect material relationship with Pitney Bowes or its management, including
current or past employment with Pitney Bowes
or its independent accountants by the director or the director’s immediate family members.accountants.
Based upon its review, the board of directors has concluded in its business judgment that the following directors are independent: Linda G. Alvarado, Anne M. Busquet, Roger Fradin, Anne Sutherland Fuchs, S. Douglas Hutcheson, Eduardo R. Menascé, Michael I. Roth, Linda S. Sanford, David L. Shedlarz, and David B. Snow, Jr.
Marc B. Lautenbach is not independent because he is a Pitney Bowes executive officer.
Communications with the Board of Directors
Stockholders and other interested parties may communicate with the Non-Executive Chairman of the board via e-mail at boardchairman@pb.com, the Audit Committee chair via e-mail at audit.chair@pb.com or they may write to one or more directors, care of the Corporate Secretary, Pitney Bowes Inc., 3001 Summer Street, Stamford, CT 06926-0700.
The board of directors has instructed the corporate secretaryCorporate Secretary to assist the Non-Executive Chairman, Audit Committee chair and the board in reviewing all electronic and written communications, as described above, as follows:
| (i) | Customer, vendor or employee complaints or concerns are investigated by management and copies are forwarded to the Chairman; |
| (ii) | If any complaints or similar communications regarding accounting, internal accounting controls or auditing matters are received, they will be forwarded by the |
| to the Audit Committee chair for review and copies will be forwarded to the Chairman. Any such matter will be investigated in accordance with the procedures established by the Audit Committee; and | |
| (iii) | Other communications raising matters that require investigation will be shared with appropriate members of management in order to permit the gathering of information relevant to the directors’ review, and will be forwarded to the director or directors to whom the communication was addressed. |
Except as provided above, the corporate secretaryCorporate Secretary will forward written communications to the full board of directors or to any individual director or directors to whom the communication is directed unless the communication is threatening, illegal or similarly inappropriate. Advertisements, solicitations for periodical or other subscriptions, and other similar communications generally will not be forwarded to the directors.
| 11 |
CORPORATE GOVERNANCE
Board Committees and Meeting Attendance
During 2014,2016, each director attended at least 75% of the total number of board meetings and meetings held by the board committees on which he or she served. The board of directors met eightseven times in 2014,2016, and the independent directors met in executive session, without any member of management in attendance, sevensix times. MembersEach member of the board of directors serveserves on one or more of the five standing committees described below. As the need arises, the board may establish ad hoc committees of the board to consider specific issues. Mr. Lautenbach is a member of the Executive Committee.
The members of all other board committees are independent directors pursuant to New York Stock Exchange independence standards. Each committee of the board operates in accordance with a charter. The members of each of the board committees are set forth in the following chart.
It is the longstanding practice and the policy of the board of directors that the directors attend the annual meeting of stockholders. All directors then serving on the board attended the May 20142016 annual meeting.
CORPORATE GOVERNANCE
| Name | Audit | Executive | Executive Compensation | Finance | Governance | ||||||
| Linda G. Alvarado | X | X | |||||||||
| Anne M. Busquet | X | X | |||||||||
| Roger Fradin | X | X | |||||||||
| Anne Sutherland Fuchs | X | X | |||||||||
| S. Douglas Hutcheson | X | X | |||||||||
| Marc B. Lautenbach | X | ||||||||||
| Eduardo R. Menascé | X | Chair | X | ||||||||
| Michael I. Roth | X | Chair | Chair | ||||||||
| David L. Shedlarz | Chair | X | X | ||||||||
| David B. Snow, Jr. | X | X | Chair | ||||||||
| Number of meetings in 2014 | 6 | 0 | 6 | 5 | 3 | ||||||
| Executive | ||||||
| Name | Audit | Executive | Compensation | Finance | Governance | |
| Linda G. Alvarado | X | X | ||||
| Anne M. Busquet | X | X | ||||
| Roger Fradin | X | X | ||||
| Anne Sutherland Fuchs | X | X | ||||
| S. Douglas Hutcheson | X | X | ||||
| Marc B. Lautenbach | X | |||||
| Eduardo R. Menascé | X | Chair | X | |||
| Michael I. Roth | X | Chair | Chair | |||
| Linda S. Sanford | X | X | ||||
| David L. Shedlarz | Chair | X | X | |||
| David B. Snow, Jr. | X | X | Chair | |||
| Number of meetings in 2016 | 7 | 0 | 8 | 5 | 6 | |
The Audit Committee monitors our financial reporting standards and practices and our internal financial controls to confirm compliance with the policies and objectives established by the board of directors and oversees our ethics and compliance programs. The committee appoints independent accountants to conduct the annual audits, and discusses with our independent accountants the scope of their examinations, with particular attention to areas where either the committee or the independent accountants believe special emphasis should be directed. The committee reviews the annual financial statements and independent accountant’s report, invites the independent accountant’s recommendations on internal controls and on other matters, and reviews the evaluation given and corrective action taken by management. It reviews the independence of the independent accountants and approves their fees. It
also reviews our internal accounting controls and the
scope and results of our internal auditing activities, and submits reports and proposals on these matters to the board. The committee is also responsible for overseeing the process by which management identifies and manages the company’s risks. The committee meets in executive session with the independent accountants and internal auditor at each committee meeting.
The Audit Committee also has oversight over the information technology function, cybersecurity risks as well as compliance generally.
The board of directors has determined that the following members of the Audit Committee are “audit committee financial experts,” as that term is defined by the SEC: S. Douglas Hutcheson, Michael I. Roth and David L. Shedlarz. All Audit Committee members are independent as independence for audit committee members is defined inunder the New York Stock Exchange standards.
The Executive Committee can act, to the extent permitted by applicable law and the company’s Restated Certificate of Incorporation and its By-laws, on matters concerning management of the business which may arise between scheduled board of directors meetings and as described in the committee’sCommittee’s charter. The Committee meets on an ad hoc basis when circumstances necessitate.
| 12 |
CORPORATE GOVERNANCE
Executive Compensation Committee
The Executive Compensation Committee is responsible for our executive compensation policies and programs. The committeeCommittee chair frequently consults with, and the committeeCommittee meets in executive session with, Pay Governance LLC, its independent compensation consultant. The committeeCommittee recommends to all of the independent directors for final approval policies, programs and specific actions regarding the compensation of the CEO and the Chief Operating Officer (COO), and approves the
same for all of our other executive offi-
cers.officers. The committeeCommittee also recommends the “Compensation Discussion and Analysis” for inclusion in our proxy statement, in accordance with the rules and regulations of the SEC, and reviews and approves stock grants and other stock-based compensation awards. All Executive Compensation Committee members are independent as independence for compensation committee members is defined in the New York Stock Exchange standards.
CORPORATE GOVERNANCE
The Finance Committee reviews our financial condition and capital structure, and evaluates significant financial policies and activities, oversees our major retirement programs, advises management and recommends financial action to the board of directors. The committee’sCommittee’s duties include monitoring our current and projected financial condition, reviewing and recommending for board
approval quarterly dividends, share repurchases,
and other major investment decisions including financing, mergers and acquisitions, divestitures and overseeing the financial operations of our retirement plans. The committeeCommittee recommends for approval by the board of directors the establishment of new retirement and post-retirement benefit plans and any amendments that materially affect cost, benefit coverages, or liabilities of the plans.
The Governance Committee recommends nominees for election to the board of directors, recommends membership in, and functions of, the board committees, reviews and recommends to the board of directors the amount and form of compensation to non-employee members of the board, and oversees CEO and senior management succession planning. The Governance Principles of the Board of Directors, which are posted on our website atwww.pitneybowes.com under the caption “Our Company—Leadership & Governance—Meet Our Leaders—Corporate Governance,” include additional information about succession planning. The committeeCommittee reviews and evaluates the effectiveness of board administration and its governing documents, and reviews and monitors company programs and policies relating to directors. The committeeCommittee reviews related-person transactions in accordance with company policy.
The Governance Committee generally identifies qualified candidates for nomination for election to the board of directors from a variety of sources, including other board members, management and stockholders. The committeeCommittee also may retain a third-party search firm to assist the committeeCommittee members in identifying and evaluating potential nominees to the board of directors.
Stockholders wishing to recommend a candidate for consideration by the Governance Committee may do so by writing to: c/o Corporate Secretary, Pitney Bowes Inc., 3001 Summer Street, Stamford, CT 06926-0700. Recommendations submitted for consideration by the committee must contain the following information: (i) the name and address of the stockholder; (ii) the name and address of the person to be nominated; (iii) a representation that the stockholder is a holder of our stock entitled to vote at the meeting; (iv) a statement in support of the stockholder’s recommendation, including a
description of the candidate’s qualifications; (v) information regard-
ingregarding the candidate as would be required to be included in a proxy statement filed in accordance with the rules of the SEC; and (vi) the candidate’s written, signed consent to serve if elected.
The Governance Committee evaluates candidates stockholders recommend based on the same criteria it uses to evaluate candidates from other sources. The Governance Principles of the Board of Directors, which are posted on our Corporate Governance website atwww.pitneybowes.com under the caption “Our Company—Leadership & Governance—Meet Our Leaders—Corporate Governance,” include a description of director qualifications. A discussion of the specific experience and qualifications the committeeCommittee identified for directors and nominees may be found under “Director Qualifications” on page 2319 of this proxy statement.
If the Governance Committee believes that a potential candidate may be appropriate for recommendation to the board of directors, there is generally a mutual exploration process, during which the committeeCommittee seeks to learn more about the candidate’s qualifications, background and interest in serving on the board of directors, and the candidate has the opportunity to learn more about the company, the board, and its governance practices. The final selection of the board’s nominees is within the sole discretion of the board of directors.
Alternatively, as referenced on page 128 of this proxy statement, stockholders intending to nominate a candidate for election by the stockholders at the meeting must comply with the procedures in Article I, Section 5 of the company’s By-laws. The By-laws are posted on our Corporate Governance website atwww.pitneybowes.com under the caption “Our Company—Our Leadership & Governance—Corporate Governance.”
| 13 |
CORPORATE GOVERNANCE
The Governance Committee assesses the contributions of each director annually, and determines the skill set for new board members. Each committee also conducts an annual self-assessment of its performance. The
board also periodically hires an outside advisor to conduct an independent review of board effectiveness, and it did so in 2016.
Role of Governance Committee in Determining Director Compensation
In accordance with the Governance Principles of the Board,board, the Governance Committee reviews and recommends to the board of directors the amount and form of compensation to non-employee members of the board of directors. The Governance Committee reviews the director compensation policy periodically and may consult from time to time with a compensation consultant, to be selected and retained by the committee,Committee, as to the competitiveness of the program.
The non-employee directors’ compensation program was last revised effective in May 2014. The compensation for the board of directors had last been modified in 2007. In 2013,connection
with its 2014 revision, the Governance Committee retained an independent compensation consultant with no other company business, Farient Advisors, to assist in its review of the director compensation program. Farient provides no other consulting services to the company.
CORPORATE GOVERNANCE
Farient presented a recommendation toTo date, the Governance Committee for changes to the board of directors compensation program, based upon an extensive analysis of comparative data, includinghas set director compensation levels at companies in the peer group used for executive compensation purposes. Farient concluded that the company’s director compensation was below market, particularly in the equity component of the program, when compared with the peer group and the broader benchmark of comparably sized companies.
Based upon its review, including the information Farient provided, the Governance Committee recommended that the board of directors approve changes to the direc-
tor compensation program. The Governance Committee recommended that the compensation level be set at aboutapproximately the 50th percentile of the total compensation in the peer and broader benchmark groups. The board of directors approved the changes to the compensation program, subject to approval by our stockholders of an amended and restated Directors’ Stock Plan at the 2014 Annual Meeting. No new shares were requested or authorized to satisfy awards under the amended and restated Directors’ Stock Plan. The revised board compensation program became effective on May 12, 2014, when the company’s stockholders approved the amended and restated Directors’ Stock Plan.
Highlights of the 2014 Changes to the Directors’ Compensation Program are:Program:
| • | Cash component paid as an annual retainer | |
| • | Leadership premiums paid to Committee Chairmen | |
| • | ||
| • | Annual equity grant in the form of restricted stock units, the number of which is calculated by dividing $100,000 by the fair market value of a share of the company’s common stock as of the award date | |
| • |
Directors’ Fees
Each non-employee director receives an annual retainer of $75,000 for board service and an additional retainer for service on the committees to which he or she is assigned. The Non-Executive Chairman of the Board receives an additional retainer of $100,000 commensurate with the additional responsibilities required of the chairman role.
Annual retainers for committee service are: $12,000 for service on the Audit Committee (with the Committee Chairman receiving an additional annual retainer of $12,000); $10,500 for service on the Executive Compensation Committee (with the Committee Chairman receiving an additional annual retainer of $10,500);
$9,000 for service on the Governance Committee (with the Committee Chairman receiving an additional annual retainer of $9,000); and $9,000 for service on the Finance Committee (with the Committee Chairman receiving an additional annual retainer of $9,000).
A meeting attendance fee of $2,000 is paid with respect to meetings of the Executive Committee. The Executive Committee did not meet in 2014.
Directors’ Fees
As noted above, beginning May 12, 2014, meeting attendance fees were discontinued. Instead, the annual retainer for board service was increased to $75,000 and each non-employee director also receives an additional retainer for service on the committees to which he or she is assigned. The annual retainers for board and committee service were prorated from the effective date of the new program to the end of the calendar year. The non-executive chairman of the board receives an additional retainer of $100,000 commensurate with the additional responsibilities required of the chairman role.
Annual retainers for committee service under the revised compensation program are: $12,000 for service on the Audit Committee (with the committee chairman receiving an additional annual retainer of $12,000); $10,500 for service on the Executive Compensation Committee (with the committee chairman receiving an additional annual retainer of $10,500); $9,000 for service on the Governance Committee (with the committee chairman receiving an additional annual retainer of $9,000); and $9,000 for service on the Finance Committee (with the
committee chairman receiving an additional annual retainer of $9,000).
For 2014 service prior May 12, 2014, non-employees were compensated under the previous director compensation program. For that period, each director who was not an employee received an annual retainer of $65,000 and a meeting fee of $1,500 for each board and committee meeting attended. Committee chairs (except for the Audit Committee chair) received an additional $1,500 for each committee meeting that they chaired, and the Audit Committee chair received an additional $2,000 for each Audit Committee meeting chaired. The Non-Executive Chairman received an additional annual retainer of $50,000. All cash retainers paid in 2014 under the previous compensation program were prorated for the portion of the calendar year covered by the previous program.2016.
All directors are reimbursed for their out-of-pocket expenses incurred in attending board and committee meetings.
Stock under the Revised DirectorDirector’s Compensation Program
Under the amended and restated Directors’ Stock Plan, each non-employee director who was not an employee of the company received an award of restricted stock units with a fair market value of $100,000 on the date of grant, which are fully vested one year after the date of grant. (Directors appointed by the board to fill a vacancy during the year receive a prorated grant of restricted stock units as
described in the Directors’ Stock Plan.) The units have no voting rights until they are converted to shares of common stock. Each non-employee director receives a quarterly cash payment equal to the amount that would have been paid
as a dividend with respect to shares represented by the restricted stock units held as of the
CORPORATE GOVERNANCE
record date for the payment of the common stock dividend. Non-employee directors may elect to defer the conversion of restricted stock units to shares until the date of termination of service as a director.
Shares shown in the table on page 2117 of this proxy statement disclosing security ownership of directors and executive officers include shares granted to the directors under the Directors’ Stock Plan.
| 14 |
CORPORATE GOVERNANCE
Director Stock Ownership Requirement
The board of directors maintains directors’ stock ownership guidelines, requiring, among other things, that each director accumulate and retain a minimum of Companycompany common stock with a market value of five times the base retainer, or $375,000, within five years of becoming a director of Pitney Bowes. All members of the board
the board of directors are currently in compliance with these guidelines. The directors’ stock ownership guidelines are available on our Corporate Governance website atwww.pitneybowes.com under the caption “Our Company—Our Leadership & Governance—Corporate Governance.”
A comparison of the revised directors’ compensation program and the previous program is shown in the table below.
COMPARISON OF REVISED AND PREVIOUS DIRECTOR COMPENSATION PROGRAMS
| Incremental Leadership | ||||||||||||||||||
| Board Member | Premiums | |||||||||||||||||
| Compensation Element | Revised | Previous | Revised | Previous | ||||||||||||||
| Board service | (Board Chairman) | |||||||||||||||||
| Cash retainer | $75,000 | $65,000 | $100,000 | $50,000 | ||||||||||||||
| Meeting fee | $0 | $1,500 | $0 | $0 | ||||||||||||||
| Equity Award | $100,000 | |||||||||||||||||
| value-based grant | 2,200 shares | |||||||||||||||||
| Annual Equity Grant | ||||||||||||||||||
| Committee service | Committee | |||||||||||||||||
| Cash retainer | Chairmen | |||||||||||||||||
| • Audit | $12,000 | $0 | $12,000 | $0 | ||||||||||||||
| • Executive Compensation | $10,500 | $0 | $10,500 | $0 | ||||||||||||||
| • Governance | $9,000 | $0 | $9,000 | $0 | ||||||||||||||
| • Finance | $9,000 | $0 | $9,000 | $0 | ||||||||||||||
| Meeting Fee | ||||||||||||||||||
| • Audit | $0 | $1,500 | $0 | $2,000 | ||||||||||||||
| • Executive Compensation | $0 | $1,500 | $0 | $1,500 | ||||||||||||||
| • All Other Committees | $0 | $1,500 | $0 | $1,500 | ||||||||||||||
| Total Compensation | @$195,000 | @$125,000 | ||||||||||||||||
| Ownership Guidelines | 5 times cash retainer; | 7,500 shares; | ||||||||||||||||
| 5 years to reach | 5 years to reach | |||||||||||||||||
| compliance | compliance | |||||||||||||||||
Directors’ Deferred Incentive Savings Plan
We maintain a Directors’ Deferred Incentive Savings Plan under which directors may defer all or part of the cash portion of their compensation. Deferred amounts will be notionally “invested” in any combination of severalsev-
eral institutional investment funds. The investment choices available to directors under this plan are the same as those offered to employees under the company’s 401(k) plan.
Directors’ Equity Deferral Plan
Directors may elect to defer all of their equity portion of their compensation on an annual basis. Deferral of restricted stock units (RSU) defers settlement of the RSU into company common stock until termination from board service. RSU awards, whether deferred or not, vest on the first anniversary of the award. Deferred
RSUs continue to receive dividend equivalents. Deferred RSUs do not have any voting rights until converted into common stock. Deferred RSUs are converted into company common stock upon the expiration of 90 days following termination of board service.
Directors’ Retirement Plan
The board discontinued the Directors’ Retirement Plan, with all benefits previously earned by directors frozen as of May 12, 1997.
Linda G. Alvarado is the only current director who is eligible to receive a retirement benefit under the plan
after termination of service on the board of directors. As
of the date the plan was frozen, she had completed five years of service as a director, the minimum years of service required to receive an annual retirement benefit of 50% of her retainer as of May 12, 1997. Therefore, she will receive an annual benefit of $15,000.$15,000 after termination from board service.
CORPORATE GOVERNANCE
DIRECTOR COMPENSATION FOR 20142016
| Change in | |||||||||||||||||
| Pension Value | |||||||||||||||||
| and Nonqualified | |||||||||||||||||
| Fees Earned or | Stock | Deferred | All Other | ||||||||||||||
| Paid in Cash | Awards | Compensation | Compensation | ||||||||||||||
| Name | ($)(1) | ($)(2) | Earnings ($)(3) | ($)(4)(5) | Total ($) | ||||||||||||
| Linda G. Alvarado | 91,500 | 100,000 | 32,780 | 7,147 | 231,427 | ||||||||||||
| Anne M. Busquet | 92,437 | 100,000 | 0 | 7,147 | 199,584 | ||||||||||||
| Roger Fradin | 90,375 | 100,000 | 0 | 7,147 | 197,522 | ||||||||||||
| Anne Sutherland Fuchs | 95,812 | 100,000 | 0 | 7,147 | 202,959 | ||||||||||||
| S. Douglas Hutcheson | 93,375 | 100,000 | 0 | 2,147 | 195,522 | ||||||||||||
| Eduardo R. Menascé | 102,000 | 100,000 | 0 | 2,147 | 204,147 | ||||||||||||
| Michael I. Roth | 184,750 | 100,000 | 0 | 7,147 | 291,897 | ||||||||||||
| David L. Shedlarz | 106,875 | 100,000 | 0 | 7,147 | 214,022 | ||||||||||||
| David B. Snow, Jr. | 101,063 | 100,000 | 0 | 2,147 | 203,210 | ||||||||||||
| Name | Fees Earned or Paid in Cash ($)(1) | Stock Awards ($)(2) | Change in Pension Value and Nonqualified Deferred Compensation Earnings ($)(3) | All Other Compensation ($)(4) | Total ($) | |||||||||||||||
| Linda G. Alvarado | 93,000 | 100,000 | 11,231 | 6,388 | 210,619 | |||||||||||||||
| Anne M. Busquet | 94,500 | 100,000 | 0 | 11,388 | 205,888 | |||||||||||||||
| Roger Fradin | 96,000 | 100,000 | 0 | 13,911 | 209,911 | |||||||||||||||
| Anne Sutherland Fuchs | 94,500 | 100,000 | 0 | 3,911 | 198,411 | |||||||||||||||
| S. Douglas Hutcheson | 96,000 | 100,000 | 0 | 9,250 | 205,250 | |||||||||||||||
| Eduardo R. Menascé | 105,000 | 100,000 | 0 | 9,250 | 214,250 | |||||||||||||||
| Michael I. Roth | 205,000 | 100,000 | 0 | 11,411 | 316,411 | |||||||||||||||
| Linda S. Sanford | 97,500 | 100,000 | 0 | 4,842 | 202,342 | |||||||||||||||
| David L. Shedlarz | 108,000 | 100,000 | 0 | 6,388 | 214,388 | |||||||||||||||
| David B. Snow, Jr. | 103,500 | 100,000 | 0 | 6,773 | 210,273 | |||||||||||||||
| (1) | |
| (2) | Represents the grant date fair value of |
| (3) | Ms. Alvarado is the only non-employee director who served on the board of directors during |
| (4) | |
| During | |
| board member per calendar year. For Messrs. Roth and Fradin, the amount shown inthis column includes a company match made in 2016 relating to a 2015 director charitable contribution. |
CORPORATE GOVERNANCE
Relationships and Related-Person Transactions
The board of directors has a written “Policy on Approval and Ratification of Related-Person Transactions” which states that the Governance Committee is responsible for reviewing and approving any related person transactions between Pitney Bowes and its directors, nominees for director, executive officers, beneficial owners of more than five percent of any class of Pitney Bowes voting stock and their “immediate family members” as defined by the rules and regulations of the SEC (related persons).
Under the related-person transaction approval policy, any newly proposed transaction between Pitney Bowes and a related person must be submitted to the Governance Committee for approval if the amount involved in the transaction or series of transactions is greater than $120,000. Any related-person transactions that have not been pre-approved by the Governance Committee must be submitted for ratification as soon as they are identified. Ongoing related-person transactions are reviewed on an annual basis. The material facts of the transaction and the related person’s interest in the transaction must be disclosed to the Governance Committee. It is the
expectation and policy of the board of directors that any related-person transactions will be at arms’ length and on terms that are fair to the company.
If the proposed transaction involves a related person who is a Pitney Bowes director or an immediate family member of a director, that director may not participate in the deliberations or vote regarding approval or ratification of the transaction but may be counted for the purposes of determining a quorum.
The following related-person transactions do not require approval by the Governance Committee:
| 1. | Any transaction with another company with which a related person’s only relationship is as an employee |
| or beneficial owner of less than ten percent of that company’s shares, if the aggregate amount invested does not exceed the greater of $1 million or two percent of that company’s consolidated gross revenues; | ||
| 2. | A relationship with a firm, corporation or other entity that engages in a transaction with Pitney Bowes where the related person’s interest in the transaction |
| 16 |
CORPORATE GOVERNANCE
arises only from his or her position as a director or limited partner of the other entity that is party to the transaction;
| 3. | Any charitable contribution by Pitney Bowes to a charitable organization where a related person is an officer, director or trustee, if the aggregate amount involved does not exceed the greater of $1 million or two percent of the charitable organization’s consolidated gross revenues; |
| 4. | Any transaction involving a related person where the rates or charges involved are determined by competitive bids; and |
| 5. | Any transaction with a related person involving services as a bank depositary of funds, transfer agent, registrar, trustee under a trust indenture, or similar services. |
The Governance Committee may delegate authority to approve related-person transactions to one or more of its members. The member to whom such authority is delegated must report, for informational purposes only, any approval or ratification decisions to the Governance Committee at its next scheduled meeting.
During 2014,2016, no transactions were submitted to the Governance Committee for review.
Compensation Committee Interlocks and Insider Participation
During 2014,2016, there were no compensation committee interlocks and no insider participation in Executive Compensation Committee decisions that were required to be reported under the rules and regulations of the Securities Exchange Act of 1934, as amended.
CORPORATE GOVERNANCE
SECURITY OWNERSHIP OF DIRECTORS AND EXECUTIVE OFFICERS
| Shares | Options | ||||||||||||
| Title of | Deemed to | Exercisable | |||||||||||
| Class of | be Beneficially | Within | |||||||||||
| Stock | Name of Beneficial Owner | Owned(1)(2)(3)(4) | 60 Days(4) | % of Class | |||||||||
| Common | Linda G. Alvarado | 37,428 | 0 | * | |||||||||
| Common | Anne M. Busquet | 15,882 | 0 | * | |||||||||
| Common | Roger Fradin | 9,997 | 0 | * | |||||||||
| Common | Anne Sutherland Fuchs | 18,763 | 0 | * | |||||||||
| Common | S. Douglas Hutcheson | 9,256 | 0 | * | |||||||||
| Common | Eduardo R. Menascé | 24,092 | 0 | * | |||||||||
| Common | Michael I. Roth | 39,170 | 0 | * | |||||||||
| Common | David L. Shedlarz | 25,892 | 0 | * | |||||||||
| Common | David B. Snow, Jr. | 17,800 | 0 | * | |||||||||
| Common | Marc B. Lautenbach | 615,827 | 500,000 | * | |||||||||
| Common | Michael Monahan | 735,249 | 635,052 | * | |||||||||
| Common | Mark L. Shearer | 25,334 | 0 | * | |||||||||
| Common | Daniel J. Goldstein | 74,344 | 39,855 | * | |||||||||
| Common | Abby F. Kohnstamm | 28,414 | 0 | * | |||||||||
| Common | All executive officers and directors as a group (17) | 2,091,272 | 1,474,946 | 1.03 | % | ||||||||
| Title of Class of Stock | Name of Beneficial Owner | Shares Deemed to be Beneficially Owned(1)(2)(3)(4) | Options Exercisable Within 60 Days(4) | % of Class | ||||||||||
| Common | Linda G. Alvarado | 51,399 | 9,888 | * | ||||||||||
| Common | Anne M. Busquet | 29,852 | 9,888 | * | ||||||||||
| Common | Roger Fradin | 24,113 | 5,485 | * | ||||||||||
| Common | Anne Sutherland Fuchs | 32,879 | 5,485 | * | ||||||||||
| Common | S. Douglas Hutcheson | 27,960 | 13,704 | * | ||||||||||
| Common | Eduardo R. Menascé | 37,796 | 13,704 | * | ||||||||||
| Common | Michael I. Roth | 53,532 | 5,485 | * | ||||||||||
| Common | Linda S. Sanford | 13,645 | 5,485 | * | ||||||||||
| Common | David L. Shedlarz | 39,862 | 9,888 | * | ||||||||||
| Common | David B. Snow, Jr. | 31,650 | 9,301 | * | ||||||||||
| Common | Marc B. Lautenbach(5) | 1,432,303 | 1,194,124 | * | ||||||||||
| Common | Robert Guidotti | 26,402 | 22,997 | * | ||||||||||
| Common | Michael Monahan | 1,168,817 | 1,010,824 | * | ||||||||||
| Common | Roger Pilc | 49,920 | 20,023 | * | ||||||||||
| Common | Mark L. Shearer | 100,063 | 30,624 | * | ||||||||||
| Common | Mark F. Wright | 61,968 | 0 | * | ||||||||||
| Common | All executive officers and directors as a group (22) | 3,808,770 | 2,796,061 | 2.01 | % | |||||||||
| * | Less than 1% of Pitney Bowes Inc. common stock. | |
| (1) | These shares represent common stock beneficially owned as of March 1, | |
| (2) | Other than with respect to ownership by family members, the reporting persons have sole voting and investment power with respect tothe shares listed. | |
| (3) | Includes shares that are held indirectly through the Pitney Bowes 401(k) Plan. | |
| (4) | The director or executive officer has the right to acquire beneficial ownership of this number of shares within 60 days of March 1, | |
| (5) | Mr. Lautenbach’s total includes three open market purchases of Company stock using his personal funds: (i) 4,739 shares (approximately$70,015) made in November 2016 (ii) 12,007 shares (approximately $250,000) made in October 2015 and (iii) 66,000 shares (approximately $1,000,000) made in May 2013. |
CORPORATE GOVERNANCE
The only persons or groups known to the company to be the beneficial owners of more than five percent of any class of the company’s voting securities are reflected in the chart below. The following information is based solely upon Schedules 13G and amendments thereto filed by the entities shown with the SEC as of the date appearing below.
| Name and Address of Beneficial Owner | Amount and Nature of Beneficial Ownership of Common Stock | Percent of Common Stock(1) | |||
The Vanguard Group, Inc. | |||||
| BlackRock, Inc. 55 East 52nd Street New York, NY | |||||
| The Bank of New York Mellon Corporation 225 Liberty Street New York, New York 10286 | 12,625,004(4) | 6.8% | |||
| Invesco Ltd. 1555 Peachtree Street NE, Suite 1800 Atlanta, GA 30309 | 9,458,334(5) | 5.1% |
| (1) | There were |
| (2) | As of |
| (3) | As of February 28, 2017, BlackRock, Inc. disclosed sole investment power with respect to 19,034,662 shares and sole voting power with respectto 18,353,648 shares. The foregoing information is based on a Schedule 13G/A filed with the SEC on March |
| As of | |
| As of December |
Section 16(a) Beneficial Ownership Reporting Compliance
Directors and persons who are considered “officers” of the company for purposes of Section 16(a) of the Securities Exchange Act of 1934 and greater than ten percent stockholders (“Reporting Persons”) are required to file reports with the SEC showing their holdings of and transactions in the company’s securities. It is generally the practice of the company to file the forms on behalf of its Reporting Persons who are directors or officers. Based solely on a review of such forms and amendments furnished to us and written representations that no other reports were required, we believe that all such forms have been timely filed for 2014.2016.
Proposal 1: Election of Directors
The board of directors believes that, as a whole, the board should include individuals with a diverse range of experience to give the board depth and breadth in the mix of skills represented for the board to oversee management on behalf of our stockholders. In addition, the board of directors believes that there are certain attributes that each director should possess, as described below. Therefore, the board of directors and the Governance Committee consider the qualifications of directors and nominees both individually and in the context of the overall composition of the board of directors.
The board of directors, with the assistance of the Governance Committee, is responsible for assembling appropriate experience and capabilities within its membership as a whole, including financial literacy and expertise needed for the Audit Committee as required by applicable law and New York Stock Exchange listing standards. The Governance Committee is responsible for reviewing and revising, as needed, criteria for the selection of directors. It also reviews and updates, from time to time, the board candidate profile used in the context of a director search, in light of the current and anticipated needs of the company and the experience and talent then represented on the board of directors. The Governance Committee reviews the qualifications of director candidates in light of the criteria approved by the board of directors and recommends candidates to the board for election by the stockholders at the annual stockholders meeting.
The Governance Committee seeks to include individuals with a variety of occupational and personal backgrounds on the board of directors in order to obtain a range of viewpoints and perspectives and to enhance the diversity of the board of directors in such areas as experience and geography, as well as race, gender, ethnicity and age.
The board believes all directors should demonstrate integrity and ethics, business acumen, sound judgment, and the ability to commit sufficient time and attention to the activities of the board of directors, as well as the absence of any conflicts with our interests.
Among other things, the board of directors has determined that it is important that the board should include members with the following skills and experiences:
| • | Financial acumenfor evaluation of financial statements and capital structure. |
| • | International experience and experience with emerging marketsto evaluate our global operations. | |
| • | Software and technology acumen, | |
| • | Operating experience, | |
| • | Human resources experience, including executive compensation experienceto help us attract, motivate and retain world-class talent. | |
| • | Corporate governance experienceat publicly traded companies to support the goals of | |
| • | Understanding of customer communications and marketing channelsto support our client focus and customer communications and marketing strategy. | |
| • | Turnaround experienceto help us assess opportunities to reposition certain of our businesses. | |
| • | Leadershipto motivate others and identify and develop leadership qualities in others. |
Additionally,When evaluating and recommending new candidates, the board believes all directors should demonstrate integrity and ethics, business acumen, sound judgment, and the ability to commit sufficient time and attention to the activities of the board of directors, as well as the absence of any conflicts with our interests.
The Governance Committee assesses the effectiveness of its criteria when evaluating and recommending new candidates.considers whether there are any skill gaps that should be addressed.
The board conducts a self-assessment of its effectiveness as well as each of its members annually. Each committee also conducts a self-assessment of its performance annually. The board also periodically hires an outside advisor to conduct an independent review of how the board functions and to provide feedback based on that review, and it did so in 2016.
Each director brings experience and skills that complement those of the other directors. The board of directors believes that all the directors nominated for election are highly qualified, and have the attributes, skills and experience required for service on the board of directors. Additional information about each director, is included withincluding biographical information, for each appearing below.appears on the following pages.
PROPOSAL 1: ELECTION OF DIRECTORS
Directors are elected to terms of one year. The board of directors has teneleven members whose terms expire in 2015.2017. Upon determining to fill an open board position, the board considers candidates submitted by outside independent recruiters, directors, members of management and others. Each of the nominees for election at the 20152017 annual meeting of stockholders is a current board member and was selected by the board of directors as a nominee in accordance with the recommendation of the Governance Committee. If elected at the 20152017 annual meeting of stockholders, each of the nominees would serve until the 20162018 annual meeting of stockholders and until his or her successor is elected
and has qualified, or until such director’s death, resignation or removal.
Information about each nominee for director including the nominee’s age, as of March 1, 2015,2017, is set forth below.
Should any nominee become unable to accept nomination or election as a director (which is not now anticipated), the persons named in the enclosed proxy will vote for such substitute nominee as may be selected by the board of directors, unless the size of the board is reduced. At the annual meeting, proxies cannot be voted for more than the teneleven director nominees.
Vote Required; Recommendation of the Board of Directors
In accordance with our By-laws, in an uncontested election, a majority of the votes cast is required for the election of directors. Abstentions and broker non-votes will not be votes cast and therefore will have no effect on the outcome of the vote. The Board of Directors Governance Principles provide that any nominee for director in this election who fails to receive a majority of votes cast in the affirmative must tender his or her resignation for consideration by the Governance Committee. The Governance Committee will recommend to the board of directors the action to be taken with respect to such offer of resignation. The board of directors will act on the Governance Committee’s recommendation and publicly disclose its decision within 90 days from the date of the certification of the election results.
The board of directors recommends that stockholders vote FOR the election of all the director nominees.

Director since:1992 Committees: Finance; Governance | Linda G. Alvarado President and
|

| 20 |
PROPOSAL 1: ELECTION OF DIRECTORS
Director since:2007 Committees: Executive Compensation; Governance | ||
 | Anne M. Busquet Principal, AMB Advisors, LLC,an independent consulting firm, since 2006; former chief executive officer, IAC Local & Media Services, a division of IAC/Interactive Corp., an Internet commerce conglomerate, 2004 – 2006.
Ms. Busquet, 67, has experience as a senior public company executive, including as American Express Company Division President, leading global interactive services initiatives. As former chief executive officer of the Local and Media Services unit of InterActiveCorp, she has experience in electronic media, communications and marketing. In addition, Ms. Busquet brings to the board of directors her substantial operational experience, including in international markets, marketing channels, emerging technologies and services, and product development. |
PROPOSAL 1: ELECTION OF DIRECTORS

 | Roger Fradin Retired, Vice Chairman, Honeywell International Inc.,a diversified technology and manufacturing
| |

Director since:2005 Committees: Executive Compensation; Governance | Anne Sutherland Fuchs Consultant to private equity firms.Formerly group president, Growth Brands Division, Digital Ventures, a division of J. C. Penney Company, Inc., a retailer, November 2010 – April 2012; former Chair of the Commission on Women’s Issues for New York City, 2002 – 2013.
Ms. Fuchs, 69, has experience as a senior executive with operational responsibility within the media and marketing industries, as well as experience as global chief executive officer of a unit of LMVH Moet Hennessy Louis Vuitton. Her experience in the publishing industry includes senior level operational roles at Hearst, Conde Nast, Hachette and CBS. She possesses experience in product development, marketing and branding, international operations, as well as in human resources and executive compensation. Her experience in managing a number of well-known magazines contributes to her knowledge and understanding of businesses closely tied to the mailing industry. Her work for the City of New York has further informed her understanding of government operations and government partnerships with the private sector. |

| 21 |
PROPOSAL 1: ELECTION OF DIRECTORS
 Director since:2012 Committees:Audit; Finance | ||
 | S. Douglas Hutcheson Chief Executive Officer, of Laser, Inc.,a privately held technology
Mr. Hutcheson, 60, brings to the board of directors significant operational and financial expertise as an experienced former chief executive officer of a wireless communications company. His broad business background includes strategic planning and product and business development and marketing. His expertise in developing and executing successful wireless strategies is an asset to Pitney Bowes as more products and services are transitioned to the cloud. In addition, his experience as a public company chief executive contributes to his knowledge of corporate governance and public company matters. | |

Director since:2012 Committees: Executive | Marc B. Lautenbach President and
|

PROPOSAL 1: ELECTION OF DIRECTORS

Eduardo R. Menascé Co-chairman, The Taylor Companies, a privately held organization that provides advisory services in mergers, acquisitions and
Mr. Menascé, 71, has broad experience as a former senior executive responsible for a significant international operation of a public company, as well as experience in senior leadership positions with a number of European and Latin American businesses, including business operations, finance and capital markets, international and emerging markets, technology, customer communications and marketing channels, and executive compensation. His experience on other public company boards contributes to his knowledge of public company matters. |
| 22 |
PROPOSAL 1: ELECTION OF DIRECTORS
Director since:1995 Committees:Chair, Executive; Chair, Finance; Audit | ||
 | Michael I. Roth Chairman and
Mr. Roth, 71, has broad experience as the chief executive officer of a public company and as a member of other public company boards of directors, as well as previous experience as a certified public accountant and attorney. In addition to his experience as chief executive officer of The Interpublic Group of Companies, his experience includes service as the chief executive officer of The MONY Group Inc. prior to its acquisition by AXA Financial, Inc. He brings to the board of directors his deep financial expertise, and experience in business operations, capital markets, international markets, emerging technologies and services, marketing channels, corporate governance, and executive compensation. | |

Director since:2015 Committees: Audit; Executive Compensation | Linda S. Sanford Retired Senior Vice President, Enterprise Transformation, International Business Machines Corporation (IBM),a global technology and services company, since December 31, 2014. Prior to her leadership role as senior vice president, enterprise transformation, which she held from January 2003 to December 31, 2014, Ms. Sanford was senior vice president & group executive, IBM Storage Systems Group. Ms. Sanford joined IBM in 1975. (Also a director of RELX Group and Consolidated Edison, Inc.) Ms. Sanford, 64, with extensive experience as a senior executive in a public global technology company, possesses a broad range of experience, including in technology, innovation and global operations. Ms. Sanford has significant expertise in business transformation, information technology infrastructure, and global process integration. | |
Director since:2001 Committees:Chair, Audit; Executive; Finance | David L. Shedlarz Retired Vice Chairman of Pfizer Inc., a pharmaceutical
Mr. Shedlarz, 68, has broad experience as a former senior executive of a public company, experience as a former chief financial officer and as a member of other public company boards of directors. He possesses financial expertise, knowledge of business operations and capital markets, international markets, emerging technologies and services, customer communications and marketing channels, human resources and executive compensation, regulatory and government affairs, product development, and corporate governance. |


| 23 |
PROPOSAL 1: ELECTION OF DIRECTORS
Director since:2006 Committees:Chair, Governance; Executive; Executive Compensation | ||
 | David B. Snow, Jr. Chairman and
|

The Audit Committee functions pursuant to a charter that is reviewed annually and was last amended in September 2013.November 2016. The committeeCommittee represents and assists the board of directors in overseeing the financial reporting process and the integrity of the company’s financial statements. The committeeCommittee is responsible for retainingthe appointment, compensation and retention of the independent accountants, and pre-approving the services they will perform, selecting the lead engagement partner, and for reviewing the performance of the independent accountants and the company’s internal audit function. The board of directors, in its business judgment, has determined that all five of the members of the committeeCommittee are “independent,” as required by applicable listing standards of the New York Stock Exchange. Three of the five members of the Committee have the requisite experience to be designated as an Audit committee financial expert as defined by the rules of the Securities and Exchange Commission.
In the performance of its responsibilities, the committeeCommittee has reviewed and discussed the audited financial statements with management and the independent accountants. The committeeCommittee has also discussed with the independent accountants the matters required to be discussed under the rules adopted by the Public Company Accounting Oversight Board (“PCAOB”). Finally, the committeeCommittee has received the written disclosures and the letter from the independent accountants required by applicable requirements of the PCAOB regarding the independent accountant’s communications with the audit committeeAudit Committee concerning independence, and has discussed with the independent accountants their independence.
In determining whether to recommend that the stockholders ratify the selection of PricewaterhouseCoopers LLP (“PricewaterhouseCoopers”) as Pitney Bowes’ independent auditoraccountants for 2015,2017, management and the committee,Committee, as they have done in prior years, engaged in a review of PricewaterhouseCoopers. In that review, the committeeCommittee considers the continued independence of PricewaterhouseCoopers, its geographic presence compared to that of Pitney Bowes, its industry knowledge, the quality of the audit and its services, the audit approach and supporting technology, any Securities and Exchange Commission actions and other legal issues as well as PCAOB inspection reports. Pitney Bowes management prepares an annual assessment that includes an analysis of (1) the above criteria for PricewaterhouseCoopers and the other “Big Four” accounting firms; (2) an assessment of whether firms outside of the “Big Four” should be considered; and (3) a detailed analysis of the PricewaterhouseCoopers’ fees. In addition, PricewaterhouseCoopers reviews with the committeeCommittee its analysis of its independence. Based on the results of this review this year, the committeeCommittee concluded that PricewaterhouseCoopers is independent and that it is in the best interests of Pitney Bowes and its investors to appoint PricewaterhouseCoopers, who have been independent accountants of the Company since 1934, to serve as Pitney Bowes’ independent registered accounting firm for 2015.2017.
Based upon the review of information received and discussions as described in this report, the committeeCommittee recommended to the board of directors that the audited financial statements be included in the company’s Annual Report on Form 10-K for the year ended December 31, 20142016 as filed with the Securities and Exchange Commission on February 20, 2015.22, 2017.
By the Audit Committee of the board of directors,
David L. Shedlarz, Chair
Roger FradinAnne Sutherland Fuchs
S. Douglas Hutcheson
Michael I. Roth
Linda S. Sanford
Proposal 2: Ratification of the Audit Committee’s Appointment of the Independent Accountants for 20152017
The Audit Committee has appointed PricewaterhouseCoopers LLP (“PricewaterhouseCoopers”) as the independent accountants for Pitney Bowes for 2015.2017. Although not required by law, this matter is being submitted to the stockholders for ratification, as a matter of good corporate governance. If this proposal is not ratified at the annual meeting by the affirmative vote of a majority of the votes cast, the Audit Committee intends to recon-
siderreconsider its appointment of PricewaterhouseCoopers as its independent accountants. PricewaterhouseCoopers has no direct or indirect financial interest in Pitney Bowes or any of its subsidiaries. A representative from PricewaterhouseCoopers is expected to attend the annual meeting and to be available to respond to appropriate questions and will have the opportunity to make a statement if he or she desires to do so.
Principal Accountant Fees and Services
Aggregate fees billed for professional services rendered for the company by PricewaterhouseCoopers for the years ended December 31, 20142016 and 2013,2015, were (in millions):
| 2014 | 2013 | 2016 | 2015 | ||||||||||||||||||
| Audit | $ | 6.9 | $ | 8.8 | $ | 5.7 | $ | 6.3 | |||||||||||||
| Audit-Related | .3 | .3 | 1.5 | .8 | |||||||||||||||||
| Tax | .8 | .6 | .5 | .5 | |||||||||||||||||
| All Other | — | — | — | — | |||||||||||||||||
| Total | $ | 8.0 | $ | 9.7 | $ | 7.7 | $ | 7.6 | |||||||||||||
Audit fees:The Audit fees for the years ended December 31, 20142016 and 20132015 were for services rendered for the audits of the consolidated financial statements and internal control over financial reporting of the company and selected subsidiaries, statutory audits, issuance of comfort letters, consents, income tax provision procedures, and assistance with review of documents filed with the SEC. The Audit fees decreased in 2014 compared with 2013 due to the additional audit services required in connection with the divestiture of Pitney Bowes Management Services in 2013.
Audit-Related Fees:fees:The Audit-Related fees for the years ended December 31, 20142016 and 20132015 were for assurance and related services related to employee benefit plan audits, procedures performed for SSAE 16 reports, attestation services pertaining to financial reporting that are not required by statute or regulation
and consultations concerning financial accounting and reporting standards.standards and for assessing and advising in the pre-implementation of the new ERP system.
Tax Fees:fees:The Tax fees for the years ended December 31, 20142016 and 20132015 were for services related to tax compliance, including the preparation and/or review of tax returns and claims for refunds.
The Audit Committee has adopted policies and procedures to pre-approve all services to be performed by PricewaterhouseCoopers. Specifically the committee’sCommittee’s policy requires pre-approval of the use of PricewaterhouseCoopers for audit services as well as detailed, specific types of services within the following categories of audit-related and non-audit services: merger and acquisition due diligence and audit services; employee benefit plan audits; tax services; procedures required to meet certain regulatory requirements; assessment of and making recommendations for improvement in internal accounting controls and selected related consultingadvisory services. The committeeAudit Committee delegates to its Chairman the authority to address requests for pre-approval services between Audit Committee meetings, if it is deemed necessary to commence the service before the next scheduled meeting of the Audit Committee. Such pre-approval decisions are discussed at the next scheduled meeting. The Committee will not approve any service prohibited by regulation.regulation or for services which, in their opinion, may impair PricewaterhouseCoopers’ independence. In each case, the committee’sCommittee’s policy is to pre-approve a specific annual budget by category for such audit, audit-related and tax services which the company anticipates obtaining from PricewaterhouseCoopers, and has required management to report the actual fees (versus budgeted fees) to the committeeCommittee on a periodic basis throughout the year. In addition, any new, unbudgeted engagement for audit services or within one of the other pre-approved categories described above must be pre-approved by the committeeCommittee or its chair.
Vote Required; Recommendation of the Board of Directors
Ratification of the appointment of Pitney Bowes’ independent accountants requires the affirmative vote of a majority of votes cast. Abstentions and broker non-votes will not be votes cast and therefore will have no effect on the outcome of the vote.
The board of directors recommends that stockholders vote FOR the ratification of PricewaterhouseCoopers LLP as our independent accountants for 2015.2017.
Proposal 3: Non-binding Advisory Vote to Approve Executive Compensation
In accordance with SEC rules, stockholders are being asked to approve, on an advisory or non-binding basis, the compensation of our named executive officers (NEOs) as disclosed in this proxy statement.
This proposal, commonly known as a “Say-On-Pay” proposal, provides our stockholders with the opportunity to express their views, on an advisory (non-binding) basis, on our executive compensation for our NEOs for fiscal year 20142016 as described in the “Compensation Discussion and Analysis” or (CD&A) beginning on page 32 of this proxy statement, as well as the “Summary Compensation Table” and other related compensation tables and narratives, on pages 5754 through 7163 of this proxy statement.
The stockholders have approved the board of directors’ recommendation to hold advisory votes onto approve executive compensation annually. At the company’s annual meeting of stockholders in 2014,2016, stockholders voted in favor of the company’s executive compensation by over 95%98% of the votes cast.
The Executive Compensation Committee (Committee) and the board of directors believe that the compensation program described in the CD&A establishes effective incentives for the sustainable achievement of positive results without encouraging unnecessary or excessive risk-taking. Our compensation program appropriately aligns pay and performance incentives with stockholder
interests and enables the company to attract and retain talented executives. The company and the Committee have reached out to stockholders to solicit their views on the company’s executive compensation structure.
Based on the company’s financial results when compared against the pre-determined financial goals established by the Committee for 2014(1) and after the application of the strategic modifier, the annual incentive payout multiplier for the NEOs was 125.1% and the 2012-2014 long-term cash incentive units award payout was $1.33 per unit.
As discussed in the CD&A, the Committee has structured our executive compensation program based on the following central principles:
| (1) | Compensation should be tied to performance and long-term stockholder return and performance-based compensation should be a greater part of total compensation for more senior positions; | |
| (2) | Compensation should reflect leadership position and responsibility; | |
| (3) | Incentive compensation should reward both short-term and long-term performance; | |
| (4) | Compensation levels should be sufficiently competitive to attract and retain talent; and | |
| (5) | Executives should own meaningful amounts of Pitney Bowes stock to align their interests with Pitney Bowes stockholders. |
We believe our executive compensation program demonstrates a strong link between pay and performance in its design and exhibits strong pay governance practices.
PROPOSAL 3: ADVISORY VOTE TO APPROVE EXECUTIVE COMPENSATION
Existing Pay for Performance and Strong Pay Governance Practices
| • | ||
| • | More than two-thirds of the total compensation paid to our CEO, and half of the total compensation paid tothe NEOs, is equity-based and aligned with shareholder interests. | |
| • | 100% of the | |
| • | 100% of the annual incentive and long-term incentive program is based on financial objectives; and | |
| • | No employment agreements with our executive officers; | |
| • | No tax gross-ups on Change-of-Control payments; | |
| • | No special arrangements whereby extra years of prior service are credited under our pension plans; | |
| • | No perquisites other than limited financial counseling and an executive physical examination benefit; | |
| • | “Double-trigger” vesting provisions in our Change-of-Control arrangements; | |
| • | A “clawback” policy that permits the company to recover | |
| • | Prohibitions against pledging and hedging of our stock; | |
| • | Executive stock ownership policy that aligns executives’ and directors’ interests with those of stockholders,recently expanded to: (i) include more senior executives, and (ii) count only vested shares toward | |
| • | Separate roles of CEO and chairman of the board of directors; | |
| • | An annual risk assessment of our pay practices; | |
| • | An annual stockholder advisory vote on executive compensation; | |
| • | A direct line of communication between our stockholders and the board of directors; | |
| • | Use of tally sheets to review each component of executive officer compensation; | |
| • | Use of two independent third-party compensation surveys (Radford Global Technology Survey | |
| • | Use of an independent compensation consultant that advises the Committee directly on the company’s compensation structure and actions and performs no other services for the company; and | |
| • | Enhanced disclosure of performance targets. | |
| • | Investor outreach regarding governance and executive compensation in spring and fall of each year. | |
We have for the past several years regularly contacted many of our stockholders to give them an opportunity to share their views about our executive compensation program. In the 2014spring of 2016, we reached out to holdersstockholders representing approximately 49% of outstanding Company shares, and in fall 2016, we reached out to stockholders representing approximately 43%51% of our outstanding Company shares to answer questions concerning the 20142016 proxy statement, including the executive compensation program. Over the past few years, the Committee has implemented features in the executive compensation program that directly related to comments received from the stockholders. We also invite our largest stockholders to provide input on executive compensation matters during the month prior to our annual meeting.
We urge stockholders to read theThe CD&A beginning on page 32 of this proxy statement which describes in more detail how our executive compensation policies and procedures operate and are designed to achieve our compensation objectives, as well as the “Summary Compensation Table” and other related compensation tables and narratives on pages 5754 through 71,63, which provide detailed information on the compensation of our NEOs.
We also invite stockholders to read our Annual Report on Form 10-K for the year ended December 31, 2014, 2016,
as filed with the Securities and Exchange Commission
on February 20, 2015,22, 2017, which describes our business and 20142016 financial results in more detail.
In accordance with Section 14A of the Exchange Act, and as a matter of good corporate governance, we are asking stockholders to indicate their support for our NEO compensation by voting FOR this advisory resolution at the 20152017 Annual Meeting:
RESOLVED, that the stockholders of Pitney Bowes Inc. approve on ana non-binding advisory basis the compensation of the company’s named executive officers disclosed in the Compensation Discussion and Analysis, the Summary Compensation Table and the related compensation tables, notes and narratives in this proxy statement for the company’s 20152017 Annual Meeting of Stockholders.
This advisory resolution, commonly referred to as a “Say-On-Pay” resolution, is non-binding on the board of directors. Although non-binding, our board of directors and the Committee will carefully review and consider the voting results when making future decisions regarding our executive compensation program. The next “Say-on-Pay” advisory vote will occur at the 20162018 annual meeting.meeting based on the recommended advisory vote on the frequency of future advisory votes on executive compensation.
PROPOSAL 3: ADVISORY VOTE TO APPROVE EXECUTIVE COMPENSATION
Vote Required; Recommendation of the Board of Directors
The vote onto approve executive compensation is an advisory vote. The affirmative vote of the majority of the votes cast will constitute the stockholders’ non-binding approval with respect to our executive compensation programs. Abstentions and broker non-votes will not be votes cast and therefore will have no effect on the outcome of the vote.
The board of directors recommends that stockholders vote FOR the approval of our executive compensation on an advisory basis.
| 29 |
Proposal 4: Non-binding Advisory Vote on the Frequency of Future Advisory Votes to Approve Executive Compensation
In addition to the advisory resolutionvote to approve executive compensation in Proposal 3 above, the Dodd-Frank Act also enables our stockholders to express their preference for having a “say-on-pay” vote every one, two or three years, or to abstain. This advisory (non-binding) “frequency” vote is required once every six years beginning with the 2011 annual meeting.
After careful consideration and in accordance with feedback received by our investor outreach, the board of directors has determined that holding an advisory vote to approve executive compensation every year is the most appropriate policy for the company at this time, and recommends that stockholders vote for future advisory votes to approve executive compensation to occur every year.
While our executive compensation programs are designed to promote a long-term connection between pay and performance, the board of directors recognizes that executive compensation disclosures are made annually. Holding an annual advisory vote to approve executive compensation provides the board of directors with more direct and immediate feedback on our compensation programs. However, stockholders should note that because the advisory vote to approve executive compensation occurs well after the beginning of the compensation year, and because the different elements of our executive compensation programs are designed
to operate in an integrated manner and to complement one another, in many cases it may not be appropriate or feasible to change our executive compensation programs in consideration of any one year’s advisory vote to approve executive compensation by the time of the following year’s annual meeting of stockholders. For your information, when we last presented this proposal to stockholders in 2014, of those who voted, 89% voted for an annual frequency.
We understand that our stockholders may have different views as to what is an appropriate frequency for advisory votes to approve executive compensation, and we will carefully review the voting results on this proposal. Stockholders will be able to specify one of four choices for this proposal on the proxy card: every year, every two years, every three years, or abstain. (Stockholders are not voting to approve or disapprove the board of directors’ recommendation.)
This advisory vote on the frequency of future advisory votes to approve executive compensation is non-binding on the board of directors. Notwithstanding the recommendation of the board of directors and the outcome of the stockholder vote, the board of directors may in the future decide to conduct advisory votes on a more or less frequent basis and may vary its practice based on factors such as discussions with stockholders and the adoption of material changes to compensation programs.
Vote Required; Recommendation of the Board of Directors
The vote on the frequency of future advisory votes to approve executive compensation is an advisory vote and the results will not be binding on the board of directors or the company. The affirmative vote of the majority of votes cast will constitute the stockholders’ non-binding approval with respect to the frequency of future advisory votes on executive compensation. Abstentions and broker non-votes will not be votes cast and therefore will have no effect on the outcome of the vote.
The board of directors recommends that stockholders vote to conduct future advisory votes to approve executive compensation EVERY YEAR.
| 30 |
Equity Compensation Plan Information
The following table provides information as of December 31, 20142016 regarding the number of shares of common stock that may be issued under our equity compensation plans.
| Plan Category | (a) Number of securities to be issued upon exercise of outstanding options, warrants and rights | (b) Weighted-average exercise price of outstanding options, warrants and rights | (c) Number of securities remaining available for future issuance under equity compensation plans excluding securities reflected in column (a) | (a) Number of securities to be issued upon exercise of outstanding options, warrants and rights | (b) Weighted-average exercise price of outstanding options, warrants and rights | (c) Number of securities remaining available for future issuance under equity compensation plans excluding securities reflected in column (a) | ||||||||||||||||||
| Equity compensation plans approved by security holders | 13,323,075 | $31.14 | 19,715,336 | 11,371,260 | $24.33 | 18,361,915 | ||||||||||||||||||
| Equity compensation plans not approved by security holders | — | — | — | — | — | — | ||||||||||||||||||
| Total | 13,323,075 | $31.14 | 19,715,336 | (1) | 11,371,260 | $24.33 | 18,361,915 | (1) | ||||||||||||||||
| (1) | These shares are available for stock awards made under |
Report of the Executive Compensation Committee
The Executive Compensation Committee (Committee) of the board of directors (1) has reviewed and discussed with management the section included below in this proxy statementbeginning on page 32 entitled “Compensation Discussion and Analysis” (CD&A) and (2) based on that review and discussion, the Committee has recommended to the board of directors that the CD&A be included in the company’s Annual Report on Form 10-K for the year ended December 31, 20142016 and this proxy statement.
By the Executive Compensation Committee of the board of directors,
Eduardo R. Menascé, Chairman
Anne M. Busquet
Anne Sutherland Fuchs
Linda S. Sanford
David B. Snow, Jr.
| 31 |
Compensation Discussion and Analysis
The following discussion and analysis contains statements regarding company performance targets and goals. These targets and goals are disclosed in the limited context of our compensation programs and should not be understood to be statements of management’s expectations or estimates of results or other guidance. Investors should not apply these statements to other contexts.
Executive Summary
Overview
This CD&A section explains our compensation philosophy, summarizes the material components of our compensation programs and reviews compensation decisions made by the Committee and the independent board members. The Committee, comprised of only independent directors, makes all compensation decisions regarding the executivesexecutive officers including those identified as Named Executive Officersnamed executive officers (NEOs) in the Summary Compensation Table below,on page 54, other than the Chief Executive Officer (CEO) and the Chief Operating Officer and Chief Financial Officer (COO). The independent board members, based on recommendations by the Committee, determine compensation actions impacting the CEO.CEO and the COO.
2014 Named Executive Officers
| 2016 Named Executive Officers | ||
| • | Marc B. Lautenbach, President and Chief Executive Officer | |
| • | Michael Monahan, Executive Vice President, Chief Operating Officer and Chief Financial Officer | |
| • | Mark L. Shearer, Executive Vice President and President, Pitney Bowes SMB | |
| • | ||
| • | Roger Pilc, Executive Vice President and Chief | |
| • | ||
Since December 3, 2012, Pitney Bowes has bifurcated the role of President and CEO and chairman of the board of directors. Marc B. Lautenbach is President and CEO and Michael I. Roth is non-executive chairman of the board of directors.
SummaryEffective February 1, 2017, Stanley J. Sutula III was appointed to the role of 2014 Business ResultsExecutive Vice President and Chief Financial Officer.
In 2014, Pitney Bowes achieved significant progress against its three strategic initiativesMr. Monahan continues to transform the company and unlock shareholder value by 1) stabilizing the mail business, 2) driving operational excellence, and 3) growing its business through expansion in digital commerce. During the year, we continued our implementation of a new go-to-market strategy, divested certain business operations, and initiated a global effort to streamline the company’s back-office systems. All aspects of our Digital Commerce Solutions segment grew revenue in 2014, including the introduction of outbound services from the United Kingdom.
In addition, we continued to deliver innovative physical and digital products and solutions and made significant investments in marketing in support of the transformation of our brand. One of the main goals of the re-branding effort is to update the market’s perception of the company. This is the first brand refresh since 1971 and only the third in our 95 year history. The new brand strategy clarifies the company’s roleserve in the changing worldrole of commerce, emphasizing the interplay between physicalExecutive Vice President and digital communications by spotlighting both our traditional strengths in mailing solutions for the small, medium and large enterprises, as well as our emerging strength in newer technology areas such as location intelligence, customer information management and cross-border commerce. The new branding launched in early January 2015.COO.
From a financial perspective:
| 32 |
COMPENSATION DISCUSSION AND ANALYSIS
2016 Summary of Business Performance
In 2016, Pitney Bowes invested significant resources and made substantial progress in positioning the Company for long-term success. Although the financial returns from our business in 2016 did not match our expectations, the Company continued to progress on its three-pronged strategy. Our three main strategic initiatives to unlock shareholder value remain the same: (1) stabilize and reinvent the mail business, (2) drive operational excellence and (3) grow the business through expansion of digital commerce. Among other things, in 2016, the Company introduced new mailing hardware products as well as multiple software applications. These enable clients to both send parcels through multiple carriers and to mail through the United States Postal Service from a single device or software application. The Company also introduced a device to enable existing hardware to connect digitally to the Company for enhanced value. The Company launched its new enterprise business platform in the United States. With the prior launch in Canada, this means that approximately 80% of the Company’s revenue base uses the new platform. The platform provides the Company with not only improved operational efficiency, but should also enhance the client experience. Although the software business unit did not perform up to expectations, it built out a partner channel to complement the direct sales force to position it for improved growth going forward. The Ecommerce business achieved double digit growth in its retail and marketplace cross-border offerings. Finally, the Company launched its first broad-based advertising campaign in twenty years to build on the initial rebranding efforts from 2015.
From a financial perspective, in 2016, the Company:
| • | ||
| • | ||
| • | ||
| • | Returned $141 million in dividends to its stockholders | |
| • | Issued $600 million of five-year notes and | |
| • | Reported adjusted earnings per diluted share from continuing operations (Adjusted EPS) of $1.68. |
In short, 2014 was a year of significant progress for Pitney Bowes. We continue to see positive trends in our businesses and are making material progress toward unlocking the long-term value embedded in our company. Going forward we remain confident about our multi-year journey to transform the company and deliver sustained value for our clients, shareholders and employees.
Some of the amounts in the CD&A portion of this proxy statement are shown on a non-GAAP basis. For a reconciliation and additional detail on the calculation of the financial results reported in this proxy statement, including those described above, please refer to page 5552 “Non-GAAP measures.” We urge stockholders to read ourOur Annual Report on Form 10-K for the year ended December 31, 2014,2016, filed with the SEC on February 20, 2015, which22, 2017 describes our business and 20142016 financial results in more detail.
Snapshot of 2016 Pay for Performance Actions
The Company divides its performance-based compensation into an annual performance component and a three-year performance component. It does so to incent management to strike an appropriate balance between the short and long term growth of the Company. The 2016 compensation short and long-term incentive plans reflect this balance and, in 2016, worked as designed to reflect the Company’s performance.
| • | Short Term Incentive Plan.In 2016, the Company fell short of the financial objectives that it utilizes in the short-term incentive plan. Consequently, there was no annual incentive paid, even though the company made substantial progress toward important strategic initiatives. | |
| • | Long Term Incentive Plan.The 2014-2016 performance period reflects the completion of the first Performance Stock Unit (PSU) award cycle. PSUs vest based on financial metrics established by the Committee and the application of a total shareholder return (TSR) modifier. In addition, the market value of the award fluctuates with the stock price. Although the early part of the three-year period reflected solid Company performance, 2016 had a significant impact on the ultimate vested percentage of 56%. Throughout the three-year period, the Company continued to invest in its future long-term success, including its enterprise resource planning system, rebranding and marketing efforts, and the overhaul of the Company’s go-to-market structure. |
See the Performance Stock Unit waterfall chart on page 34 of this proxy statement.
| 33 |
COMPENSATION DISCUSSION AND ANALYSIS
The following tables compare the actual payouts in 2016 and 2015:
| Annual Incentive | 2016 Actual Payout Factor as a % of Target | 2015 Actual Payout Factoras a % of Target | Percentage change 2016 vs. 2015 | |||||||||
| Financial Objectives | 0.0 | % | 62.2 | % | ||||||||
| Strategic Modifier(1) | — | 7.0 | % | |||||||||
| Subtotal | — | 69.2 | % | |||||||||
| Performance Adjustment | — | (12.2 | %) | |||||||||
| Total Payout Factor | 0.0 | % | 57.0 | % | (100.0 | %) | ||||||
| Long-Term Incentive | 2016 Actual Unit Multiplier Value (2014 – 2016 PSU cycle) | 2015 Actual Unit Payout Value (2013 – 2015 CIU cycle) | Percentage change 2016 vs. 2015 | |||||||||
| Adjusted Earnings per Share | 0.46 | $0.79 | ||||||||||
| Adjusted Free Cash Flow | 0.29 | $0.56 | ||||||||||
| TSR Modifier(2) | (0.19 | ) | $0.34 | |||||||||
| Total Multiplier/Payout Value | 0.56 | $1.69 | (66.9 | %) | ||||||||
| (1) | The strategic modifier objectives in 2016 included measures of performance against a Net Promoter Score as well as employee engagement metrics based on employee survey results. Based on overall performance against financial objectives, the strategic modifier was not considered for 2016. |
| (2) | The TSR Modifier is a cumulative three-year modifier, which modifies the final payout by up to +/– 25% based on the company’s TSR as compared to the company’s peer group (see page 44). The relative TSR modifier for the 2013 – 2015 CIU cycle and 2014 – 2016 PSU cycle was +25% and -25%, respectively. |
2014-2016 Performance Stock Unit Vesting Multiplier
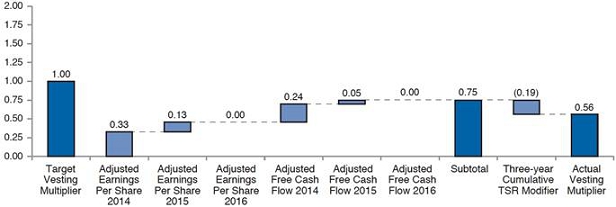
The amounts above include the impact of the TSR Modifier. The sum of the metrics may not exactly equal the total due to rounding.
For additional detail on the calculation of the financial metrics described above, please refer to page 52 “Non-GAAP Measures” and corresponding table. Also see “2016 Compensation” beginning on page 41 of this proxy statement for a discussion of each of the compensation components and the respective payouts.
| 34 |
COMPENSATION DISCUSSION AND ANALYSIS
CEO 20142016 Compensation
In deciding to focus the CEO’s compensation on the long-term success of the company, the board made no increase for 2016 to his base salary ($950,000) and annual incentive target (135%). In connection with the reintroduction of stock options as part of the long-term incentive compensation, the Company adjusted his long-term incentive target ($5,500,000) to be comprised of 60% Performance Stock Units (PSUs) (70% previously), 20% Restricted Stock Units (RSUs) (30% previously) and 20% Nonqualified Stock Options (NSOs).
The compensation package of our President and CEO reflects Pitney Bowes’ enhanced performance-linked pay philosophy and is competitive when compared to our peer group and two third-party compensation survey reports (see description on competitive benchmarking of compensation on pages 5047 to 51)49).
The following are characteristics of Mr. Lautenbach’s compensation compared against our peer group and the average of the Willis Towers Watson Regressed Compensation Report and the Radford High Tech IndustryGlobal Technology Survey (Survey Reports);
| Percentage of median | Percentage of median | |
| Peer Group CEOs | Survey Reports CEOs | |
| Base Compensation* | 91% | 88% |
| Total Cash Compensation* | 93% | 90% |
| Total Direct Compensation* | 96% | 98% |
COMPENSATION DISCUSSION AND ANALYSIS:
Pitney Bowes CEO Compensation vs. Benchmarks
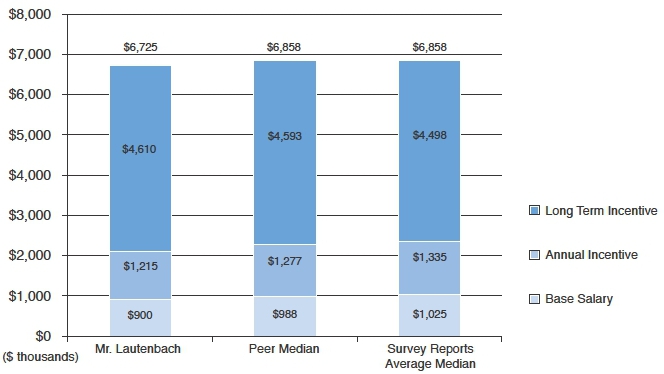
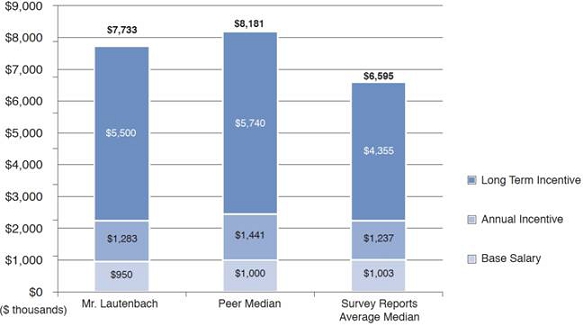
In the above illustration, because the peer median and the average median data of the Survey Reports is reported at target, Mr. Lautenbach’s compensation elements are also illustrated at target for comparison purposes.
Mr. Lautenbach’s long-term incentive amount includes the value of his one-time sign-on grant of premium-priced stock options, which are amortized over the vesting period of the options.
Pitney Bowes CEO % of Pay
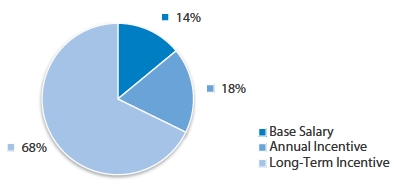
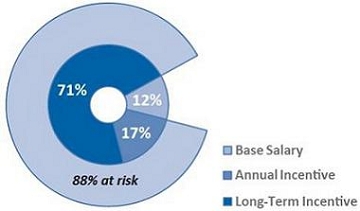
The following highlights 2014 compensation actions for the President and CEO approved by the board of directors:
COMPENSATION DISCUSSION AND ANALYSIS
Snapshot of 2014 Pay for Performance Actions
In making its 2014 compensation decisions and recommendations, the Committee considered the following, among other things:
Our 2014 TSR was a solid 7.63%, which followed a 2013 TSR of 132%, resulting in a compound annual growth rate (CAGR) of 58.23% over two calendar years. Pitney Bowes’ two-year CAGR placed it first among its peer group. This illustrates the significant improvement occurring in our businesses over the last two years. Including 2012, the year preceding both Mr. Lautenbach’s tenure as CEO and the initiation of the current three-year strategic plan, our three-year cumulative TSR is 16.99% and places us at the 33rd percentile of our peer group.
Based on 2014 financial results, the Committee and independent board members approved an annual incentive payout of 125.1% of target, after application of the Strategic Modifier. For the 2012 – 2014 Cash Incentive Units (CIUs), part of the company’s long-term incentive award, the Committee approved a CIU payout of $1.33 per unit, after application of the TSR Modifier.
The following tables compare the actual payouts in 2014 and 2013:
| 2014 Actual Payout | 2013 Actual Payout | Percentage change | ||||||||||
| Annual Incentive | Factor as a % of Target | Factor as a % of Target | 2014 vs. 2013 | |||||||||
| Financial Objectives | 115.7 | % | 100.5 | % | ||||||||
| Strategic Modifier(1) | 9.4 | % | 9.0 | % | ||||||||
| Subtotal | 125.1 | % | 109.5 | % | ||||||||
| Total Payout Factor | 125.1 | % | 109.5 | % | 14.2 | % | ||||||
| 2014 Actual Unit Payout | 2013 Actual Unit Payout | Percentage change | ||||||||||
| Long-Term Incentive | Value (2012 – 2014 cycle) | Value (2011 – 2013 cycle) | 2014 vs. 2013 | |||||||||
| Adjusted Earnings per Share | $0.85 | $0.83 | ||||||||||
| Adjusted Free Cash Flow | $0.71 | $0.77 | ||||||||||
| TSR Modifier(2) | ($0.23 | ) | ($0.10 | ) | ||||||||
| Subtotal | $1.33 | $1.50 | ||||||||||
| Total Payout Value | $1.33 | $1.50 | (11.3 | %) | ||||||||
For additional detail on the calculation of the financial metrics described above please refer to page 55 “Non-GAAP Measures” and corresponding table. Also see “2014 Compensation” beginning on page 42 of this proxy statement for a discussion of each of the compensation components and the respective payouts.
| 35 |
COMPENSATION DISCUSSION AND ANALYSIS
Funding2016 CEO Realizable Compensation.The previous chart illustrated that 88% of the 2014 Annual Incentive PoolCEO’s pay is at risk based on Company performance. The chart below demonstrates how our compensation structure is strongly linked to Company performance and Payout Multiplier
![]()
The sum of the metrics may not exactly equal the total due to rounding.CEO Realizable Compensation
For additional detail on the calculation of the financial metrics shown in this chart please refer to the table on page 55 “Non-GAAP Measures.”
Funding of the 2014 Cash Incentive Unit Pool and Payout Value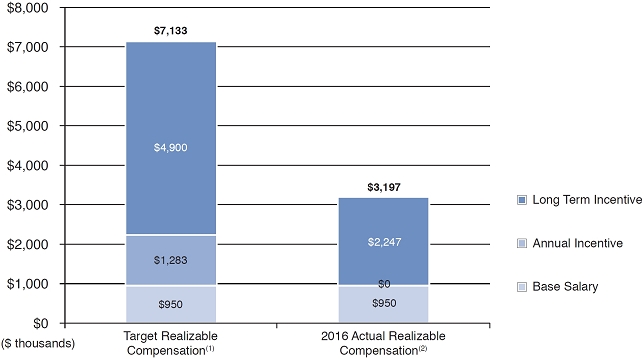
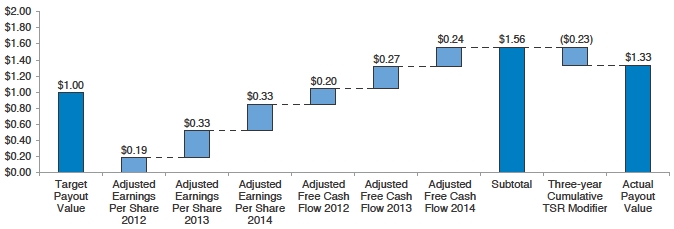
The amounts above include the impact of the Modifier for total shareholder return (TSR). The sum of the metrics may not exactly equal the total due to rounding.
The amounts shown in the charts above are based on non-GAAP measures. For additional detail on the calculation of the financial metrics shown in this chart please refer to the table on page 55 “Non-GAAP Measures.”
| Target Realizable Compensation represents 2016 current base salary, 2016 target annual incentive, and: (i) the grant date target value of the RSU awards which had a prorated vesting in 2016, as disclosed in the “Options Exercised and Stock Vested” table on page 59, and (ii) the grant date target value of the 2014-2016 PSU award. | |
| (2) | 2016 Actual Realizable Compensation represents 2016 base salary, 2016 actual annual incentive, and: (i) the value realizable upon vesting of the RSU awards which had a prorated vesting in 2016, as disclosed in the “Options Exercised and Stock Vested” table on page 59, and (ii) the value of the 2014-2016 PSU award based on the final performance factor of 0.56 and the closing stock price as of December 31, 2016. |
COMPENSATION DISCUSSION AND ANALYSIS
Summary of 2014 Executive Compensation Changes
At the company’s annual meeting of stockholders in 2014, stockholders voted in favor of our executive compensation by over 95% of votes cast. Management and the Committee maintain a commitment to obtaining and considering stockholder feedback on the company’s compensation program by soliciting feedback over the course of the year. Most of the changes in 2013 were made as a result of stockholder outreach and the 2012 Say-On-Pay vote. The following highlights the changes that were made to the program in 2014 and in 2013.

KEY
COMPENSATION
ACTIONS
2014
Implemented new LTI design mix for 2014 awards,
making 100% of the long-term awards stock based, with anallocation of 70% PSUs and 30% RSUs;
Rolled out a new executive stock ownership policy to: (i) includemore senior executives, and (ii) restrict the shares that will counttoward stock holding requirement to only vested shares; and
Instituted a deferral program to facilitate a quicker path toexecutive stock ownership.
2013
Increased the weighting of financial objectives to 100% for the annual incentive program;
Enhanced disclosure of performance targets;
Revised our peer group in light of the company’s evolving strategic direction with increasedemphasis in software and technology;
Reduced severance benefits payable on account of a Change-of-Control from three to two timesannual salary and average annual incentive; and
Eliminated the excise tax gross-up.
These highlights will be discussed in more detail in the section titled “2014 Compensation” beginning on page 42 of this proxy statement.
COMPENSATION DISCUSSION AND ANALYSIS
Executive Compensation Program Structure
Compensation Philosophy
We link executive compensation to the performance of the company as a whole. We believe executives with higher levels of responsibility and a greater ability to influence enterprise results should receive a greater percentage of their compensation as performance-based compensation. Compensation for our NEOs varies from year to year primarily based on achievement of enterprise-wide objectives and in some instances individual performance. We emphasize enterprise-wide performance to break down any internal barriers that can arise in organizations that emphasize individual performance. We believe our compensation structure encourages reasonable risk-taking but discourages taking excessive risks.
Our executive compensation program is designed to recognize and reward outstanding achievement and to attract, retain and motivate our leaders. We solicit feedback from our major stockholders regarding our executive compensation program, and management speaks individually to stockholders who wish to provide input.
The Committee considers stockholder feedback to determine whether changes to At the company’s annual meeting of stockholders in 2016, stockholders voted in favor of the company’s executive compensation programs are required. The Committee continually reviewsby over 98% of the executive compensation programs to ensure proper alignment with stockholder interests.votes cast.
Below is an overview of key aspects of our pay philosophy.
| Overall Objectives | • | Compensation levels should be sufficiently competitive to attract and retain talent; | |
| • | Compensation should reflect leadership position and responsibility; | ||
| • | Executive compensation should be linked to the performance of the company as a whole; | ||
| • | Compensation should motivate our executives to deliver our short and long-term business objectives and strategy; and | ||
| • | Compensation packages should be designed to preserve tax | ||
| Pay Mix Principles | • | Compensation should be tied to short-term performance and creation of long-term stockholder value and return; | |
| • | Performance-based compensation should be a significant portion of total compensation for executives with higher levels of responsibility and a greater ability to influence enterprise results; and | ||
| • | Executives should own meaningful amounts of Pitney Bowes stock to align their interests with Pitney Bowes stockholders. | ||
| Pay for Performance | • | Incentive compensation should reward both short-term and long-term performance; | |
| • | A significant portion of our compensation should be variable based on performance; and | ||
| • | The annual and long-term incentive components should be linked to operational outcomes, financial results or stock price | ||
| 37 |
COMPENSATION DISCUSSION AND ANALYSIS
Stockholder Engagement – Executive Compensation
It is our practice to conduct stockholder outreach calls and meetings twice a year in the spring and fall. We contact stockholders holding approximately 50% of our outstanding shares and actively seek their views on various governance topics and executive compensation matters. We also periodically engage proxy advisory firms for their viewpoints. If requested, we offer various board members to discuss these matters with our investors. In 2016, our Chairs of the Governance and Executive Compensation Committees joined in certain discussions.
| Here’s What We Heard | ||
 | Overall our investors provided positive feedback on the structure of our executive compensation | |
| Our investors approved the alignment of our compensation programs with company’s performance and | |
| Our investors were specifically pleased about the multiple triggers in vesting, the way we benchmark against two independent surveys as well as company peers and | |
| | Our investors asked us to streamline the proxywhere possible, simplify explanations, and providegraphic displays to make it easier to read | |
| | Our investors questioned why we had eliminateda relative total shareholder return metric from our2016 long-term incentive PSU award | |
| Here’s What We’ve Done | ||
| | We’ve tried to simplify and streamline certain sections of the proxy presentation to avoid duplication of material where possible | |
| | We introduced new charts to assist in the presentation of the material | |
| | We reintroduced a relative total shareholderreturn modifier in our 2017 long-term incentivePSU award | |
| | We have provided more explanations as to whycertain actions were taken by the Committee withrespect to compensation | |
| | We provided a chart which shows total target realizable pay compared to actual realizable pay indicating a clear alignment between pay and performance | |
| 38 |
COMPENSATION DISCUSSION AND ANALYSIS
Strong Compensation and Pay Governance Practices
We believe our executive compensation program demonstrates a strong link between pay and performance in its design and exhibits strong governance pay practices. The following lists the principal pay for performance and governance practices adopted by the board.
 |
| ||
| share price | |||
| 100% of
| ||
| |||
| | Double trigger vesting
| ||
| | Significant stock ownership guidelines for senior executives and directors
| ||
| | Enhanced disclosure of performance targets | ||
| | Independent compensation consultant performing no other services for | ||
| | Clawback provisions in event of financial restatement | ||
| | Annual stockholder advisory vote on executive compensation | ||
| | Significant CEO pay at risk (88%) | ||
| | Independent Chairman of board of directors | ||
| | Annual risk-assessment of pay practices | ||
| | Semi-annual stockholder outreach with direct line of communication with board of directors | ||
 | No individual supplemental executive retirement plans |
| | No special arrangement crediting extra years of service in our benefit plans |
| | No tax gross-up in change of control payments |
| | No hedging, pledging or short-term speculative trading of Company stock |
| | No employment agreements with our executive officers |
| | No stock option repricing, reloads or exchanges |
| | No transferability of restricted securities |
| | No dividends on unvested stock awards |
Focus on Variable Pay
The chart below shows the 2014 targeted compensation mix for the CEO and other NEOs compared with the targeted average compensation of our peer group as reported in their 2014 proxy statements. As illustrated in the chart, our compensation is (i) well aligned to the compensation mix of our peer group and (ii) predominantly variable. The specific proportion of each compensation element below may change with changes in market practices or performance considerations.
Design Mix of Compensation Elements
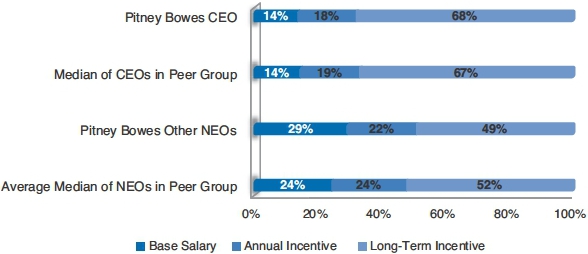
This chart does not include special stock option and stock grants made to the CEO and other NEOs upon hire.
| 39 |
COMPENSATION DISCUSSION AND ANALYSIS
We design the mix of short and long-term incentives to reward and motivate short-term performance, while at the same time providing significant incentives to keep our executives focused on longer-term corporate goals that drive stockholder value. In addition, we believe this balance of short-term and long-term incentive compensation and mix of performance criteria helps to discourage executives from taking excessive risk that may have the potential to harm the company in the long-term. We review the compensation structure annually to make sure that it does not encourage excessive risk taking and report our findings to the Committee.
In determining our executive’s grant levels, we take into consideration the following:
Due to the qualitative nature of these considerations, we do not assign specific weightings or numerical goals to them.
Overview of Compensation Components
The Committee is responsible for determining the compensation for all NEOs, other than the CEO and COO, and for recommending to the independent members of the board of directors (as a whole) each specific element of compensation for the CEO.CEO and COO. The Committee considers recommendations from the CEO regarding the compensation of other NEOs. The independent board members are responsible for determining the CEO’s and COO’s compensation. No member of the management team, including the CEO, has a role in determining his or her own compensation.
For each NEO, the Committee sets, as a guideline, target total direct compensation levels so the base salary, total cash compensation, and total direct compensation is at +/–- 20% of the median of the competitive data based on the Willis Towers Watson Regressed Compensation Report, as regressed for companies approximately our size, and the Radford High-Tech IndustryGlobal Technology Survey focusing on companies with revenue scopes similar to ours for each position. We describe these two reports in more detail under “Assessing Competitive Practice” beginning on page 5047 of this proxy statement. In order to attract or retain specific talent, the general +/– 20% of the median guideline +/- 20% may be exceeded.
For 2014,2016, the total target cash compensation (base salary plus annual incentive) and total target direct compensation (base salary plus annual incentive plus long-term incentive) for Mr. Lautenbach were 90%100% and 98%117%, respectively, of the market median(1)for CEOs. For the NEOs, as a group, the average total target cash compensation and total direct compensation were 105%107% and 110%117%, respectively, of the market median(1).median.
| (1) | Market median is the average of the median CEO pay as reported in the Willis Towers Watson Regressed Compensation Report and the Radford |
COMPENSATION DISCUSSION AND ANALYSIS
The following table outlines the components of direct compensation for our NEOs and how they align with our compensation principles.
| What it Rewards | |||||||||
| Base Salary |
•Increases influenced by executive’s individual performance rating | ||||||||
•Performance of daily job duties •Highly developed skills and abilities critical to the success of the company | |||||||||
| •
| ||||||||
|
|
•Individual performance may be considered in establishing executives’ annual incentive opportunity
| • | ||||||
| Long-term Incentives | |||||||||
| •Performance-based equitycompensation measured on enterprise-wide metrics | •Achievement of •established cumulative objectives • |
|
| ||||||
•Change in company’s stock price compared to peer group for awards made prior to 2016 | |||||||||
| Performance-Based RestrictedStock Units (RSUs) | •Performance-based equitycompensation measured on a threshold financial target | •
|
| ||||||
COMPENSATION DISCUSSION AND ANALYSIS
• | |||||||||
|
| • | |||||||
|
|
| • | ||||||
| Periodic Off-cycle Long-term Awards | |||||||||
| •Depends on award granted | •The Committee may also grant |
| |||||||
We also provide certain other benefits for our NEOs, including retirement benefits and deferred compensation plans. For additional information, please see “Other Indirect Compensation” on page 4845 of this proxy statement.
| 40 |
COMPENSATION DISCUSSION AND ANALYSIS
20142016 Compensation
Overview2016 Highlights
In 2014, the Committee implemented changes to the compensation program emphasizing further alignment of executive compensation with the company’s stockholders. We increased the percentage of equity awards in the company’s long-term compensation plan, implemented changes to executive stock ownership requirements, and instituted a deferral program to facilitate a quicker path to executive stock ownership.
In addition the company used a net promoter score (a universal metric for client satisfaction) as part of its strategic modifier to the annual incentive program. The strategic modifier can increase the annual incentive pay-out by up to ten percentage points.
| • | Stock options were reintroduced as a component of the company’s long-term incentive plan. |
| • | We believe stock options strongly align with shareholder interests and emphasize the creation of long-term value in how the company rewards its executives. |
| • | Performance Stock Unit awards for the 2016-2018 cycle utilize three-year cumulative performance metrics in determining payouts. |
| o | Performance Stock Unit awards vest based on achievement of Adjusted Free Cash Flow and Adjusted Earnings Per Share. | |
| o | In order to focus on financial goals inherent to driving the long-term strategy, the 2016-2018 PSU awards do not include a TSR modifier. |
The changes made in 2014 built on the significant changes the company made to its compensation programs in 2013.
Base Salary
In February 2014, based onMr. Lautenbach’s annual salary did not increase for 2016. For the business results for 2013, the Committee and the independent directors increased the CEO’s base salary by 6%, bringing his
base salary closer to market median based on competitive benchmarks.other NEOs excluding CEO, base salary increases in 2016 averaged 2.8%1.4%.
COMPENSATION DISCUSSION AND ANALYSIS
Annual Incentives
NEOs are eligible forThere were no annual incentives underawarded to any of the KEIP primarilyNEOs for achieving challenging enterprise-wide2016 based on performance against the established objectives.
Annual Incentives
The annual incentive plan is based 100% on the Company’s financial performance, demonstrating our commitment to place rigor and objectivity in establishing and meeting our compensation goals. The following lists the financial objectives established at the beginning of each year. Individual performance and its impact on financial, strategic, unit or individual objectives may be considered.
2014 Annual Incentive Objectives and Metrics
In 2014, 100% ofused under the annual incentive was based on financial objectivesplan, along with the reasoning for each, which are shown in the chart below. The chart also shows the threshold, target, and maximum ranges.
| Financial Objectives | Weighting | Threshold | Target | Maximum |
| Adjusted Earnings Before Interest and Taxes(1) | 35% | $672 million | $718 million | $775 million |
| Adjusted Revenue Growth(1) | 25% | –1.0% | 0.5% | 2.0% |
| Adjusted Free Cash Flow(1) | 40% | $400 million | $440 million | $500 million |
Wewe believe that together these financial objectives effectively measure how well our business is performing on a short-term basis and represent appropriate metrics upon which to base annual incentive awards. We limited the number of duplicative metrics across annual and long-term incentives. The 2014 annual incentive program includes the following metrics and the reasons why they are important to company performance.
basis:
| • | Adjusted free cash flow (Adjusted FCF). The ability to generate free cash flow on a short-term basis is extremely important as it allows the company to manage its current financial needs. | |
| • | Adjusted earnings before interest and | |
| • | Adjusted revenue growth. This is an appropriate measure because it indicates whether our business is expanding, after excluding the impact of foreign currency translation and the disposal of certain business operations. | |
Each of these metrics excludes the impact of certain special items, both positive and negative, which could mask the underlying trend or performance within a business. The adjustments for special items are made consistently year-to-year and are explained on page 5552 in “Non-GAAP Measures.”
Adjusted free cash flow is the only metric that we use in both our annual and long-term incentive program. We believe that the ability to generate free cash flow allows the company to manage its current financial needs and is central to the company’s future health and ability to take advantageapply a Strategic Modifier of growth opportunities as they are presented. Free cash flow is also a strong contributor to long-term stockholder value.
We set the targets for the adjusted earnings before interest and taxes and adjusted free cash flow financial objectives close to the midpoint of guidance provided to stockholders and the financial community at the beginning of 2014. The only revision to targets during the course of the year reflected the revision to guidance announced as a result of the sale of the Canada Document Imaging Solutions (DIS) business. We believe that the 2014 financial objectives at each level (threshold, target and maximum) accurately balance the difficulty of attainment of the level with the related payout. The 2014 annual incentive plan design includes 100% financial metrics, demonstrating our commitment to place more rigor and objectivity in establishing and meeting our compensation goals. Strategic metrics (Strategic Modifier) are applied as a modifier to compensation payouts by up to ten percentage points.points in determining final compensation payouts. The Strategic Modifier is based on the achievement of enterprise strategic goals. Strategic goals are targets that are important to the successful operation of the enterprise above and beyond financial goals. The strategic goals for 2014 included2016 were (i) employee engagement and (ii) client satisfaction. Employee engagement is meant to measure, through employee surveys,Voice of the company’s progress toward implementing a high-performance client-oriented culture. Client, satisfaction is measured by the implementation and progress made againstas a net promoter score a universal metric utilized to measure client satisfaction.and (ii) High Performance Culture, measured from an annual employee survey. These important strategic goals are the foundation for our future business success and essential for positive financial results.
| 41 |
COMPENSATION DISCUSSION AND ANALYSIS
The table below shows the weighting of the metrics as well as the various levels of achievement relating to the 2016 annual incentive:
| Target | Actual | Actual Payout as | |||||||||||||||||||||
| Financial Objectives(1) | Weighting | Threshold | Target | Maximum | Result | a % of Target | |||||||||||||||||
| Adjusted Earnings Before Interest and Taxes(2) | 35 | % | $689 million | $734 million | $779 million | $638 million | 0 | % | |||||||||||||||
| Adjusted Revenue Growth(2) | 25 | % | -2.0 | % | 0.5 | % | 3.0 | % | -3.2 | % | 0 | % | |||||||||||
| Adjusted Free Cash Flow(2) | 40 | % | $385 million | $435 million | $485 million | $312 million | 0 | % | |||||||||||||||
| (1) | We set the targets for the Adjusted EBIT, Adjusted revenue growth and Adjusted FCF financial objectives relative to overall guidance provided to stockholders and the financial community at the beginning of 2016. We believe that the 2016 financial objectives at each level (threshold, target and maximum) accurately balance the difficulty of attainment of the level with the related payout. |
| (2) | For compensation purposes, (a) Adjusted EBIT is translated at 2016 budget rates and presented on a continuing operations basis excluding any nonrecurring items; (b) Adjusted revenue growth is presented on a continuing operations and constant currency basis; and (c) Adjusted FCF excludes reserve account deposits and changes in finance receivables. Adjusted EBIT, Adjusted revenue growth and Adjusted FCF are non-GAAP measures. For a reconciliation and additional information, please see “Non-GAAP Measures” on page 52 of this proxy statement. |
Funding of the Annual Incentive Pool and 20142016 Actual Payout
Funding of the annual incentive pool begins with the sum of the annual incentive targets of eligible Pitney Bowes Incentive Plan (PBIP) participants. For more information on setting the target see “Assessing Competitive Practice” on page 50. After the close of the
COMPENSATION DISCUSSION AND ANALYSIS47.
calendar year, the Committee determines the company’s achievement of the overall financial results against each metric (see above) and approves a multiplier to be applied to the sum of the annual incentive targets. For NEOs, executive officers, unit presidents and staff vice presidents, the annual incentive iswould only be paid if the company achieves its IRCSection 162(m) threshold target
goal of $256,583,000$246,208,000 in income from continuing operations, as restated excluding certain special events. (See “Treatment of Special Events” beginning on page 5552 of this proxy statement.) This target was establishedis intended to allow payments under the annual incentive program to qualify
as performance-based compensation for purposes of IRCCode Section 162(m). Actual 2014 adjusted2016 income from continuing operations, excluding all special events, was $387,414,000. The initial threshold of adjusted income from continuing operations was adjusted to exclude the sale of the Canada DIS business. The adjustment was made according to predetermined definitions when the target was originally established and is also reflected in actual results.
The chart below shows actual financial results and the payout as compared to target.
| Objectives | Target Weighting | Actual Result | Actual Payout as a % of Target |
| Financial Objectives: | |||
| Adjusted Earnings Before Interest and Taxes(1) | 35% | $731 million | 37.8% |
| Adjusted Revenue Growth(1) | 25% | 1.6% | 31.4% |
| Adjusted Free Cash Flow(1) | 40% | $467 million | 46.4% |
| Total | 100% | n/a | 115.7% |
The Committee compared the 2014 performance against the financial targets and approved a 2014 annual incentive multiplier of 115.7%. Next the Committee assessed the predetermined strategic goals for 2014 which included improving client satisfaction and implementing employee engagement and culture change throughout the organization.
The goals above represent a 15% closure in gap to goal of 100%.
Noting the significant progress achieved in both strategic metrics above, the Committee, and independent board members with respect to the CEO, added a 9.4% Strategic Modifier resulting in a final annual incentive multiplier of 125.1%.$317,402,000.
Based on the above analysis, Mr. Lautenbach made recommendations to the Committee for his direct reports. The Committee considered those recommendations and the actualfinancial performance against objectives as shown resulting inabove, the annual incentive awards to our NEOs as follows:pool was not funded for 2016.
COMPENSATION DISCUSSION AND ANALYSIS
| Executive | Target Award | Payout | Payout Percent to Target |
| Marc B. Lautenbach | $1,215,000 | $1,519,965 | 125.1% |
| Michael Monahan | $485,856 | $607,806 | 125.1% |
| Abby F. Kohnstamm | $448,000 | $560,448 | 125.1% |
| Mark L. Shearer | $457,320 | $572,107 | 125.1% |
| Daniel J. Goldstein | $295,033 | $369,087 | 125.1% |
Long-term Incentives
Long-term incentives link the NEOs’ rewards to the company’s long-term financial performance and stock price. We also pay long-term incentives in order to be competitive in the markets in which we operate and in order to attract and retain high-performing executives.
In 2014, in order to tie executive rewards closerLong-term incentive awards are linked to changes in shareholder value and continue to be 100% equity based. In 2016, the Committee changedaward mix consisted of 60% PSUs, 20% performance-based RSUs and 20% NSOs. Stock denominated grants, by their nature, convey market-based standards over time.
In 2016 we made the design mixfollowing changes to our long-term incentive awards. With respect to PSUs, three-year cumulative metrics were substituted for the 2014 LTI awards to 100% equity (70% PSUsprevious series of one-year metrics aggregated over three years and 30% performance-based RSUs) to further align long-term incentives with long-term stockholder interests. As a result, allthe three-year Total Shareholder Return versus peers modifier was eliminated. The purpose of the change to the three-year cumulative metrics underlying the 2016-2018 PSU awards was to focus our effort on the company’s long-term executive compensation structure will be impacted by changesfinancial goals, instead of a relative metric such as a TSR modifier. In addition to our long-term incentive program being 100% equity-based, stock options were reintroduced in company2016. The reintroduction of stock price.options further strengthens our commitment to strong long-term growth from a stockholder perspective, as these awards have value only if Company stock price increases.
Performance Stock Units (PSUs)
PSUs which the Committee decided will be granted in place of CIUs beginning in 2014, have many of the same features as the previously granted CIUs, except that the PSUs are based on and settled in stock instead of cash. The new LTI mix of 100% equity further aligns the LTI program with market best practices. In addition, the vesting period for the RSUs was changed from four years to three years to better align with the company’s strategic plan.
As a result of the way equity-based PSUs and cash-based CIUs are reported on the Summary Compensation Table, beginning in 2014, you will see a “bunching” of award values. The outstanding and previously granted cash-based CIU awards will continue to be reflected as required under SEC rules when paid, but the equity denominated PSUs are required to be reported when granted. Although it may appear from a review of the Summary Compensation Table that the total value of LTI has increased, in fact, it only reflects the different timing of when cash versus equity is reported in accordance with SEC requirements. Since outstanding and previously awarded CIUs will continue to vest through 2016, this “bunching” effect also will continue through 2016.
Cash Incentive Units (CIUs)
CIUs are long-term cashequity awards granted annually prior to 2014 with three yearthree-year performance and vesting cycles.cycles and in 2016 constituted 60% of a NEO’s long-term incentive award. At any given time there will be three PSU cycles outstanding. The vesting of long-term incentive awards are generally subject to achieving an average income from continuing operations (IFCO) financial threshold target over the cycle period, established for purposes of IRCCode Section 162(m). At any given time there are three cycles outstanding. NEOs are awarded CIUs with payoutsIf the average IFCO target is not met, then the entire award is forfeited. In addition, vesting of PSUs is based on achieving various challenging enterprise-wide financial objectives established at the beginning of each year of the three-year cycle. If the threshold level of performance for the enterprise-wide financial objectives are not met for a calendar year, one-third of the award value will be forfeited. Beginning with the 2014 – 2016 cycle, we have eliminated this component of LTI compensation and replaced it with PSUs, discussed below. As a result, the last remaining CIU award cycle will end in 2015 and is payable in 2016.objectives.
The enterprise-wide financial objectives set by the Committee include adjusted earnings per share and adjusted free cash flow. We believe both of these financial factors are important indicators of the company’s long-term viability and performance and align with the Company’s long-term growth strategy, and thus are appropriate metrics upon which to base long-term incentive awards. Adjusted earnings per share is an appropriate measure of long-term profitability, and strong adjusted free cash flow provides us with needed resources to reposition and pursue new growth opportunities.
| • | Adjusted earnings per share (Adjusted EPS) is an appropriate measure of long-term profitability. | |
| • | Adjusted FCF provides us with needed resources to reposition and pursue new growth opportunities. While we recognize that this metric is also utilized in our short-term one-year goal, we believe Adjusted FCF is important as well to the Com- |
| 42 |
COMPENSATION DISCUSSION AND ANALYSIS
| pany’s long-term success, measured over a three-year period. |
The Committee generally sets the financial targets close to the midpoint ofconsidering the guidance we provide to stockholders and the financial community at the beginning of each year.investment community. Subsequent revisions of guidance during the course of the year do not affect the targets set at the beginning of a year. Before finalizing payouts,Our long-term financial targets take into account budgeted levels of share repurchases. The Committee believes it sets the objectives with the appropriate level of difficulty and stretch for each grant.
The number of PSUs granted at target in 2016 was determined by dividing the target amount by the closing price of company stock on the date of grant.
The number of shares vesting at the end of the cycle can range from 0 to 200% of the initial number granted based on achievement of the Committee approved financial goals. The Committee also can employ discretion in determining the vesting percentage to reflect more accurately the Company’s overall performance.
For PSUs awarded prior to 2016, the Committee established enterprise-wide financial objectives at the beginning of each year of the three-year performance cycle. At the end of the three-year cycle the Committee ranks the company’sCompany’s cumulative three-year TSR against the cumulative three-year TSR of each company in the peer group.group and adjusts the final payout by plus or minus 25%. The Committee believes it setTSR modifier cannot result in a positive adjustment if there is a negative TSR over the 2014 objectives as it relates to previously awarded CIUs with the appropriate level of difficulty and stretch for each target.three-year cycle.
COMPENSATION DISCUSSION AND ANALYSIS
CIUPerformance Stock Units (PSUs) Objectives and Metrics for completed 2014-2016 grant cycle
The 2012 – 2014table below shows the financial objectives,metrics, each weighted at 50%, are stated below:and various levels of achievement relating to the 2014-2016 PSUs:
| 2012 – 2014 LTI Adjusted Earnings Per Share(1) | Threshold | Target | Maximum |
| 2012 | $1.72 | $2.15 | $2.22 |
| 2013 | $1.53 | $1.71 | $1.88 |
| 2014 | $1.60 | $1.76 | $1.95 |
| 2012 – 2014 LTI Adjusted Free Cash Flow(1) | Threshold | Target | Maximum |
| 2012 | $684 | $760 | $790 |
| 2013 | $573 | $623 | $673 |
| 2014 | $400 | $440 | $500 |
2014 Funding of the Cash Incentive Unit Pool and Actual Payout
For the 2012 – 2014 CIU cycle, the unit value at target is $1.00. The CIU value range is between $0 and $2.00 based upon the achievement of the pre-determined financial objectives described above, each weighted at 50%. The Committee modifies the resulting unit value by up to +/– 25% based on our cumulative three-year TSR as ranked against the cumulative three-year TSR of companies within our peer group linking payout to our relative TSR.
For NEOs, executive officers, unit presidents and staff vice presidents the 2012 – 2014 CIU cycle is only paid if the company achieves the restated IRC 162(m)
threshold target of average income from continuing operations over the cycle of $339,706,000, excluding certain special events. (See “Treatment of Special Events” beginning on page 55 of this proxy statement.) Average annual income from continuing operations for the 2012 – 2014 CIU cycle was $377,264,000, which exceeded the performance threshold. The IRC 162(m) threshold for adjusted income from continuing operations for 2012 – 2014 was restated to eliminate the impact of disposal of certain business operations, in accordance with predetermined definitions of income from continuing operations. The chart below shows actual results as compared to target before and after applying the TSR Modifier for the 2012 - 2014 cycle.
| Objectives | Actual Result | Metric Payout Value | TSR Modifier | Final Payout Value |
| 2012 – 2014 LTI Adjusted Earnings Per Share(1) | ||||
| 2012 | $2.16 | $0.19 | ||
| 2013 | $1.88 | $0.33 | ||
| 2014 | $1.95 | $0.33 | ||
| 2012 – 2014 LTI Adjusted Free Cash Flow(1) | ||||
| 2012 | $767 million | $0.20 | ||
| 2013 | $655 million | $0.27 | ||
| 2014 | $467 million | $0.24 | ||
| Total | $1.56 | (15%) | $1.33 |
| Metric | Final | |||||||||||
| 2014 – 2016 | Actual | Payout | TSR | Performance | ||||||||
| Adjusted Earnings Per Share(1) | Threshold | Target | Maximum | Result | Value | Modifier | Multiplier | |||||
| 2014 | $1.60 | $1.76 | $1.95 | $1.95 | 0.33 | |||||||
| 2015 | $1.65 | $1.85 | $2.00 | $1.79 | 0.13 | |||||||
| 2016 | $1.75 | $1.90 | $2.05 | $1.68 | 0.00 | |||||||
| Metric | ||||||||||||
| 2014 – 2016 | Actual | Payout | ||||||||||
| Adjusted Free Cash Flow(1) | Threshold | Target | Maximum | Result | Value | |||||||
| 2014 | $400 million | $440 million | $500 million | $467 million | 0.24 | |||||||
| 2015 | $380 million | $405 million | $455 million | $384 million | 0.05 | |||||||
| 2016 | $385 million | $435 million | $485 million | $312 million | 0.00 | |||||||
| Total | 0.75 | -25% | 0.56 | |||||||||
| (1) | For compensation purposes, (a) adjusted earnings per share includes the benefit received from the company’s divestiture of a partnership investment; and (b) adjusted free cash flow excludes reserve account deposits and changes in finance receivables. Adjusted EPS and adjusted free cash flow are non-GAAP measures. For a reconciliation and additional information, please see “Non-GAAP Measures” on page |
For the 2014 – 2016 PSU cycle, the unit multiplier at target is 100%. The PSU multiplier range is between 0% and 200% based upon the achievement of the pre-determined financial objectives described above, each weighted at 50%. The Committee modifies the resulting unit value by up to +/– 25% based on our cumulative three-year TSR as ranked against the cumulative three-year TSR of companies within our peer group linking pay-out to our relative TSR. If TSR is negative for the cumulative three-year period, there is no positive application of the TSR modifier. Based on relative performance versus our peer group over the cumulative three-year period, the TSR modifier is applied as shown on page 44.
COMPENSATION DISCUSSION AND ANALYSIS
| PBI rank vs. Peer Group | Modifier |
| Above 75th %ile | +25% |
| 70th to 75th %ile | +20% |
| 65th to 70th %ile | +15% |
| 60th to 65th %ile | +10% |
| 55th to 60th %ile | +5% |
| 45th to 55th %ile | +0% |
| 40th to 45th %ile | –5% |
| 35th to 40th %ile | –10% |
| 30th to 35th %ile | –15% |
| 25th to 30th %ile | –20% |
| Below 25th %ile | –25% |
The TSR Modifier in aggregate decreased
For NEOs, executive officers, unit presidents and staff vice presidents the CIU pay-out level2014-2016 PSU cycle is only vested if the company achieves the Section 162(m) threshold goal of average income from continuing operations over the cycle of $266,468,000, excluding certain special events. (See “Treatment of Special Events” beginning on page 52 of this proxy statement.) Average annual income from continuing operations for the 2012 – 20142014-2016 PSU cycle by -15%.was $352,181,000, which exceeded the performance threshold.
The CIU payoutBased on the 2014-2016 PSU performance multiplier of 0.56 per unit, the NEOs each vested in the following number of PSUs in February 2015, for the 2012 – 2014 cycle, was $1.33 per unit. This compares to the 2011 – 2013 cycle pay-out which was $1.50 per unit.2017:
| Executive | Target PSUs Awarded | Performance Multiplier | Units Vested |
| Marc B. Lautenbach | 125,448 | 0.56 | 70,251 |
| Michael Monahan | 36,241 | 0.56 | 20,295 |
| Mark L. Shearer | 36,241 | 0.56 | 20,295 |
| Robert Guidotti | N/A | N/A | N/A |
| Roger Pilc | 13,939 | 0.56 | 7,806 |
| Mark F. Wright(1) | 20,908 | 0.56 | 9,757 |
| (1) | Mr. Wright’s 2014-2016 PSU award is prorated based on his July 1, 2016 termination date. |
Performance-Based Restricted Stock Units
An annual grant of performance-based restricted stock units (RSUs) is made during the first quarter of the year. While RSUs continue to support the executives’ long-term outlook, they also act as a significant retention tool.
For NEOs, executive officers, unit presidents and staff vice presidents, no RSUs will vest unless the company achieves at least the IRCSection 162(m) threshold target of $256,583,000$246,208,000 income from continuing operations, as restated excluding certain special events.events in 2016. (See “Treatment of Special Events” beginning on page 5552 of this proxy statement.) Actual 20142016 income from continuing operations, excluding all special events, was $387,414,000,$317,402,000 which exceeded the target. The IRC 162(m) threshold targets for income from continuing operations and actual 2014 income from continuing operations were adjusted to eliminate the impact of the disposal of certain business operations in accordance with the predetermined definition of income from continuing operations.
In 2014, the percentage2016 performance-based RSUs comprised 20% of thea NEO’s long-term incentive award made up by RSUs was reduced from 40% to 30%.award. The 20142016 award vests in three equal installments commencing on the first anniversary of the grant date if the executive is still employed on the installment vesting date. If the initial income from continuing operations target had not been achieved, the RSUs granted in 20142016 would have been forfeited.
PerformanceNonqualified Stock Units (PSUs)Options (NSOs)
Beginning in 2014, PSUs replaced CIUs, makingIn 2016, the Committee reintroduced stock options as a component of the company’s long-term incentive mix entirely equity based. PSUs are long-term equity awards granted annually with three year performance and vesting cycles. At any given time after three yearsplan. An annual grant of PSU awards there will be three PSU cycles outstanding. The vesting of long-term incentive awards are generally subject to achieving an average IFCO financial threshold target established for purposes of IRC 162(m). Ifstock options is made during the average IFCO target is not met, then the entire award is forfeited. In addition, vesting of PSUs are based on achieving various challenging enterprise-wide financial objectives established at the beginning of each yearfirst quarter of the three-year cycle. If the enterprise-wide financial objectives are not met for a calendar year, one-third of the award will be forfeited.
The enterprise-wide financial objectives set by the Committee include adjusted earnings per share and adjusted free cash flow. We believe both of these financial factors are important indicators of the company’s long-term viability and performance and thus are appropriate metrics upon which to base long-term incentive awards. Adjusted earnings per share is an appropriate measure of long-term profitability, and strong adjusted free cash flow provides us with needed resources to reposition and pursue new growth opportunities.
The Committee generally sets the financial targets close to the midpoint of the guidance we provide to stockholders and the financial community at the beginning of each year. Subsequent revisions of guidance during the course of the year do not affect the targets set at the beginning of a year. Before finalizing payouts, the Committee ranks the company’s cumulative three-year TSR against the cumulative three-year TSR of each Company in the peer group and can adjust the final payout by plus or minus 25%. The TSR modifier cannot result in a positive adjustment if there is a negative TSR over the three-year cycle. The Committee believes it set the 2014 objectives with the appropriate level of difficulty and stretch for each target.
The number of PSUs granted at target is determined using Monte-Carlo simulation modelling. Monte-Carlo simulation modelling is a generally accepted statistical technique used, in this instance, to simulate a range of possible future prices for Pitney Bowes common stock based on various inputs, including stock volatility, dividend yield, expected term, and risk-free rates.
The number of shares vesting at the end of the cycle can range from 0 to 200% of the initial number granted based on achievement of the Committee approved financial goals and application of the cumulative three-year TSR modifier. The Committee also can employ negative discretion to reduce the payout even if the financial goals are achieved based on overall company performance.
Performance-Based Market Stock Units
Performance-based market stock units (MSUs) were granted to executive officers, including NEOs, in February 2012 for the first and only time. In 2013, the Committee determined that MSUs would no longer be a part of the company’s executive compensation structure. The number of MSUs that can vest is capped at 200% of the number of MSUs originally granted. A minimum number of shares, comprising 50% of the award, will vest at the end of the three-year performance period.
The number of performance-based MSUs that will vest is based on (i) the company’s TSR over the vesting period and (ii) the executives’ continued employment until the vesting date. The number of units which will vest is determined by multiplying the number of units awarded by a fraction, the numerator of which is the Pitney Bowes ending stock price, $24.01(1), plus cumulative dividends paid on outstanding company stock during the vesting period, $3.19, and the denominator, of which is the Pitney Bowes beginning stock price, $19.26(2). Vesting of the MSU awards was also based on the company’s achievement of an IFCO target, $383,665,000, in the initial year of the award, which was met. Based on the company’s TSR over the award period, a multiplier of 1.41 was applied to the target number of 2012 MSU awards.
COMPENSATION DISCUSSION AND ANALYSIS
Periodic Off-Cycle Long-Term Awards
In special circumstances, the Committee, or in the case of the CEO, the independent members of the board of directors, may determine that it is appropriate to make additional grants to executives during the course of the year.
On February 8, 2016, the named executive officers were awarded an annual grant of stock options to purchase common stock of the company under the 2013 Stock Plan at an exercise price of $16.82 per share, the closing price of our common stock on the day of grant. These stock options have a ten-year exercise period and will vest and become exercisable in equal installments over three years commencing on the first anniversary after the date of grant, subject to continued service through each such vesting date.
| 44 |
COMPENSATION DISCUSSION AND ANALYSIS
Periodic Off-Cycle Long-Term Awards
No off-cycle long-term awards were made to NEOs in 2016. In special circumstances, the Committee, or in the case of the CEO and COO, the independent board members, may determine that it is appropriate to make
additional long-term award grants to executives during the course of the year. In some cases, these awards are part of the long-term incentive awards made to hires during the course of a calendar year, and in other cases, these awards are in addition to the long-term incentive awards made in any given year.
In February 2014, the Committee awarded an additional tranche of RSUs to Ms. Kohnstamm that was promised
in connection with her hiring in 2013. The additional tranche is subject to an adjusted income from continuing operations performance metric with a one-year vesting provision.
See details of the grants to Ms. Kohnstamm in the “Grants of Plan-Based Awards in 2014” table on page 59 of this proxy statement.
In June 2014, Ms. Kohnstamm was awarded the second half of her cash sign-on award in connection with her hiring.
Other Indirect Compensation
Retirement Compensation
In the United States, retirement benefits include:
| • | ||
| Qualified and nonqualified restoration 401(k) plans with company matching contributions up to 4% of eligible compensation and 2% company core | ||
| • | Qualified and nonqualified restoration pension plans for employees hired prior to January 1, 2005. Accruals under these plans were frozen at the end of 2014. Only one NEO qualifies for this benefit. |
Nonqualified plans are unfunded obligations of the company subject to claims by our creditors. Nonqualified restoration plans (pension and 401(k)) are based on the same formulas as are used under the qualified plans and make up for benefits that would have been provided under the qualified plan except for limitations set forth under the Internal Revenue Code of 1986, as amended (IRC).amended. Restoration plans are available to a select group of management or highly compensated employees, including the NEOs.
Nonqualified plans are unfunded obligations of the company subject to claims by our creditors. An individual account under the 401(k) Restoration Plan:
| • | is adjusted on the basis of notional investment returns of publicly-available mutual fund investments; and | |
| • | does not receive any above-market earnings. |
The Pension Restoration Plan applies the same standard actuarial rules as are applied under the qualified Pension Plan.
Effective December 31, 2014, the board of directors approved the freezing of all future Pension Plan benefit accruals for all employees.
Similar amendments were adopted with respect to the Pension Restoration Plan. At the same time, the board of directors amended the 401(k) Plan and the 401(k) Restoration Plan, effective January 1, 2015, to provide eligibility to participate in the 2% employer core contri-
bution to those employees who will no longer accrue benefits under the Pension Plan. The 2% employer core contribution has been in effect since 2005 when the Pension Plan was closed to new employees hired after December 31, 2004.
For additional information, please see the narrative accompanying the “Pension Benefits as of December 31, 2014”2016” table on page 6460 and the narrative accompanying the “Nonqualified Deferred Compensation for 2014”2016” table beginning on pages 65 to 66page 61 of this proxy statement.
Other Benefits
Other benefits include:
| • | Nonqualified Deferred Incentive Savings Plan: | ||
| o | Provides a savings vehicle in a tax efficient manner | ||
| o | Provides certain executives the ability to voluntarily defer payouts of annual cash incentives | ||
| • | ||||
| • | ||||
| Relocation assistance for executives asked to move to a new work location facilitates the placement of the right person in the job and aids in developing talent | ||||
| • | ||||
COMPENSATION DISCUSSION AND ANALYSIS
Process for Determining Named Executive Officer Compensation
Committee
The Committee is responsible for reviewing the performance of and approving compensation awarded to our executive officers, other than the CEO.CEO and COO. The independent board members, with the input of the Committee, annually(i) set the CEO’s individual target compensation and performance targets annually for the CEO and COO, (ii) review histheir performance, and(iii) determine histheir compensation pay-out in the context ofpay-outs by comparing actual performance
against the established objectives and approve the actual
performance against those objectives and the TSR.TSR modifier. In addition, the Committee, and the independent board members with respect to the CEO and COO, may exercise negative discretion in its sole determination. The Committee works closely with its independent consultant, Pay Governance LLC, and management to examine various pay and performance matters throughout the year.
| 45 |
COMPENSATION DISCUSSION AND ANALYSIS
Independent Compensation Consultant
The Committee retains Pay Governance as its independent compensation consultant and considers advice and information provided by Pay Governance in determining the compensation for the CEO and the other NEOs. The consultant regularly attends the Committee meetings and advises on a range of matters, including peer group composition, plan design, and competitive pay practices. The consultant does not perform other services for the company. We incurred $46,077$88,462 in fees for Pay Governance for services performed for the Committee during 2014.2016. The Committee considered the following six factors and determined there was no conflict in the engagement of Pay Governance and that Pay Governance is independent: (i) the provision of other services to the company by Pay Governance; (ii) the amount of fees received from the company by Pay Gov-
Governance,ernance, as a percentage of the total revenue of Pay Governance; (iii) the policies and procedures of Pay Governance that are designed to prevent conflicts of interest; (iv) any business or personal relationship of the Pay Governance consultant with a member of the Committee; (v) any company stock owned by the Pay Governance consultants; and (vi) any business or personal relationship of the Pay Governance consultant or Pay Governance with any of the company’s executive officers. The Committee has the sole authority to hire and terminate its consultant.
The Committee also reviews independence factors applicable to other consultants, including, outside law firms and Willis Towers Watson, management’s compensation consultant.
Determining Compensation—The Decision Process
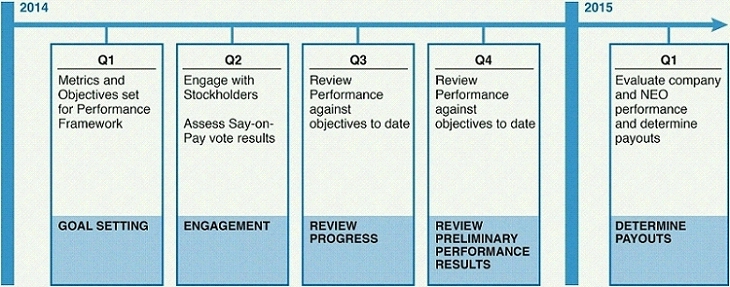
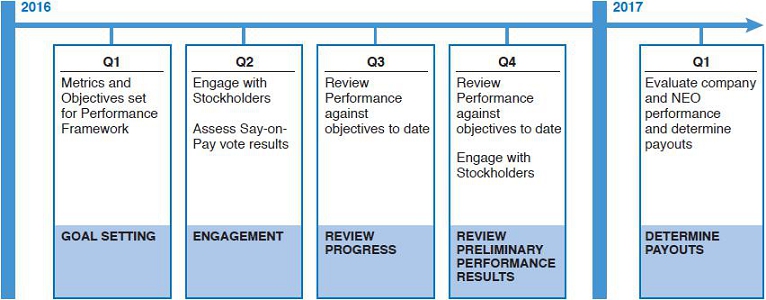
At the beginning of each year our CEO, on behalf of senior management, recommends to the Committee financial objectives for the annual and long-term incentive plans based on the financial objectives set by the board of directors.directors in light of guidance provided to the investment community. The Committee and the independent directors review the recommendations of management particularly with respect to the appropriateness and rigor of the objectives and approve the final annual and long term objectives.
After reviewing benchmarking data presented by external consultants, our CEO and Executive Vice President
and Chief Human Resources Officer recommend compensation target levels for total direct compensation as well as the annual and long-term incentive compensation for executive officers, including the NEOs, other than the CEO.CEO and COO. The Committee reviews management’s recommendations and determines the appropriate financial objectives, base salary and the target levels of annual and long-term incentive compensation. The Committee also recommends for approval by the independent board members the CEO’s base salary and
annual and long-term incentive target levels.levels for the CEO and COO. Generally at this time,
COMPENSATION DISCUSSION AND ANALYSIS
the Committee also approves any changes to the compensation program for the coming year.
At the end of each year, each NEO completes a written self-assessment of his or her performance against his or her objectives. The CEO evaluates the performance of his executive officer direct reports and recommends incentive compensation actions other than for himself to the Committee. The Committee recommends to the independent board members an individual rating for the CEO. The Committee reviews the financial accomplishments of the company, taking into account predetermined objectives for the preceding year, and determines actual base salary increases as well as the annual and long-term incentive compensation for the NEOs and recommends for approval by the independent board members the CEO’s compensation.compensation for the CEO and COO. The actual payout levels for annual incentive compensation are based upon the company’s performance against the predetermined financial objectives and other criteria, as discussed in further detail under “Annual Incentives”
| 46 |
COMPENSATION DISCUSSION AND ANALYSIS
beginning on page 43.41. For long-term incentive compensation, the recommendation to the Committee for payout levels is based on pre-determined financial objectives and for awards prior to 2016, a relative TSR Modifier,modifier, as discussed in further detail under “Long-term Incentives” beginning on page 4542 of this proxy statement.
To assist in this process, the Committee also reviews tally sheets prepared by the Human Resources depart-
mentdepartment to evaluate the individual components and the total mix of compensation. The tally sheets show the dollar amount of each of the components of each executive officer’s compensation, summarizing the total compensation opportunity, including the executive’s fixedcurrent and variable compensation, perquisites and potential payments upon termination or Change of Control. In addition, the tally sheets include a summary of historical compensation. These tally sheets aid the Committee in analyzing the individual compensation components as well as the compensation mix and weighting of the components within the total compensation package.
To evaluate whether each NEO’s compensation package is competitive with the marketplace, the Committee, and with respect to the CEO and COO, the independent board members, also review each executive’s total direct compensation against market data during the benchmarking process as more fully described in “Assessing Competitive Practice” below. Based on the structure of our current management team, the Committee and the board strive to ensure that the relationship between the compensation paid to the CEO and the second highest paid NEO are within acceptable market norms, subject to considerations such as performance, the market median compensation of the respective positions, contributions to the company and experience that may lead to deviations from market relationships.
Assessing Competitive Practice
To evaluate whether Pitney Bowes’ executive compensation is competitive in the marketplace, the Committee annually compares each executive’s total direct compensation (base salary, annual incentive and long-term incentives) against two independent reports with a view towards determining the optimal mix and level of compensation, the Willis Towers Watson Regressed Compensation Report (Towers(Willis Towers Watson Report) and the Radford High-Tech IndustryGlobal Technology Survey Report (Radford Report). WeThe Committee then reviewreviews the targets and actual payouts against publicly available data from our peer group to evaluate ongoing compensation opportunity and competitiveness. Finally, the Committee’s independent compensation consultant reviews the data presented to the Committee, before the Committee establishes the target total direct compensation structure. The Committee sets compensation targets assuming achievement of specific incentive award performance objectives at target.
The Willis Towers Watson data is regressed for corporate revenue of approximately $4.0 billion for corporate leaders and actual regressed revenue for business unit leaders. The Willis Towers Watson Report is a sub-section of the 20142016 US Compensation Data Bank (CDB) General Industry Executive Database. The Radford Report is regressed for corporate revenue of approximately $3.0 - $5.0 billion for corporate leaders and bases its analysis on applicable revenue ranges as they pertain to various roles. The Radford Report is derived from a database of survey results from high-tech companies. The Committee believes using the Willis Towers Watson Report regressed revenue scope and Radford Reports assist the revenue rangesCommittee in the Radford Report more accurately reflect
determining market competitiveness of executive officer compensation against outside companies. However, the exact number of companies included in the data for each executive position may vary depending on the structure of the applicable company and whether the company submitted the relevant data.external benchmarks.
This market data provides important reference points for the Committee but is not the sole basis for determining appropriate compensation design, compensation targets, or individual pay levels. Use of comparative industry data and outside surveys only serves to indicate to the Committee whether those decisions are in line with industry in general and our peer group in particular. The
Committee believes that the comparative industry data used from the Willis Towers Watson Report, the Radford Report and the peer group are consistent with our compensation philosophy. In addition, compensation targets and individual pay levels may vary from the median for various reasons, including:
the value of the total rewards package; program design and strategic considerations; affordability; | ||
COMPENSATION DISCUSSION AND ANALYSIS
In making its determination that the Pitney Bowes compensation package is appropriate and competitive, the Committee takes the following actions.
The Committee first identifies for each NEO the median of the data presented in the Willis Towers Watson and Radford Reports in determining target base salary, target total cash compensation and target total direct compensation. In making its final determination on any one position, the Committee will also take into account unique skill sets presented by the employee.
In addition, as a supplement to the Towers Watson and Radford Reports, the Committee asks Pay Governance to perform its analysisanalyze the appropriateness of the Company’s short and provide its opinion on the specificlong-term compensation program design. The Committee and the board also consider the burn rate with respect to the equity awards when deciding how much of the total direct compensation package should be composed of equity-based awards. Burn rate is the total equity awarded in a fiscal year divided by the total common stock outstanding at the beginning of the year. Our three-year average burn rate for the time period from 20122014 to 20142016 is 0.86% (down from 1.00% based on the prior year three-year average),1.12% and is well below the median burn rate of 1.60%1.40% for S&P 1500500 companies in fiscal year 20132015 (source: Equilar 20142016 Equity Trends Report).
| 47 |
COMPENSATION DISCUSSION AND ANALYSIS
Next, the Committee annually reviews our relative performance, compensation targets and actual payouts against the relative performance and compensation of the peer group listed below.
Based on this rigorous review, the Committee has determined that the Pitney Bowes total compensation package for 20142016 is appropriate and competitive considering all the factors outlined above.
PEER GROUP
Peer Group
Although weIn 2016, the Committee reviewed the composition of the peer group and approved changes effective as of January 1, 2017 for the purposes of benchmarking NEO peer median pay levels, conducting pay practice reviews, and measuring TSR if included in future award designs. We made these changes as a result of some changes occurring in the businesses of our peers as well as the ongoing transformation of the Company. The peer group was last modified in 2014. We do not have a single completely overlapping competitor due to the unique mix of our business, however, we use a peer group of companies similar in size and complexity to benchmark our executive compensation. In 2014,Our new peer
group consists of companies with revenues between $1.5 billion and $10.7 billion, and market capitalization between $0.7 billion and $24.8 billion. Xerox remains in our peer group despite the revenue size difference because the Committee reviewedconsiders it a direct peer in the compositionoffice equipment space and it also experienced a transformation in its core business.
Following its evaluation of the peer group, the Committee determined that four companies would be eliminated, while another three would be added.
The Committee eliminated the following companies from the peer group:
| Peer Company Removed | Reason |
| Lexmark International Inc. | Became private in 2016 |
| Harris Corporation | Spun-off printing business and became highly concentrated on defense |
| Iron Mountain Inc. | Became a REIT |
| DST Systems Inc. | Sold its print and electronic communications business |
The Committee added the following companies to provide greater industry focus and decidedrelevant size characteristics to the peer group:
| Peer Company Added | Reason |
| Deluxe Corporation | Primary focus on Small and Medium Business (SMB) and providing custom packaging and logistics |
| Teradata Corporation | Aligns strongly with our data analytics portfolio |
| NetApp Inc. | Represents a balanced equipment and software comparator with exposure to the Ecommerce market |
The peer group for the 2014-2016 PSU cycle TSR calculation remains as currently constituted before the changes outlined above, with the exception of Lexmark, which became a private entity.
Regarding the 2015-2017 PSU cycle TSR calculation, the peer group will be modified by excluding the four companies identified for removal, as well as any company experiencing a structural change by December 31, 2017 that no changes were necessary. dictates exclusion. The new peer additions will not be included for this calculation.
Pay Governance and the Committee designed our peer group so the Committee could analyze compensation packages, including compensation mix and other benefits, within the competitive market to attract and retain the talent and skill required to lead our business. This peer group consists of services, industrial and technology companies. When evaluating the appropriateness of the peer group, the Committee considered factors such as revenue, net income, market capitalization, number of employees, and complexity of the business to ensure a reasonable balance in terms of company size and an adequate number of peers. The Committee also considered any feedback received from stockholders. Our peer group consists of companies with revenues between $2.7 billion and $21.1 billion, and market capitalization between $1.5 billion and $18.3 billion.
The Committee decided to continue to include Xerox in our peer group despite the revenue size difference because the Committee considers it our closest direct peer in the office equipment space and it also is undergoing a similar transformation in its core business.
COMPENSATION DISCUSSION AND ANALYSIS
Peer Group as of December 31, 2016(1)
| Fiscal 2016 | 12/31/2016 | ||||||||||||||||||||||||||||||||||||||||
| Revenue | Market Capitalization | Total Stockholder Return | |||||||||||||||||||||||||||||||||||||||
| Company Name | Fiscal 2014 Revenue ($ millions) | 12/31/2014 Market Capitalization ($ millions) | 1-Year | Total Stockholder Return 3-Year | 5-Year | ($ millions) | ($ millions) | 1-Year | 3-Year | 5-Year | |||||||||||||||||||||||||||||||
| Alliance Data Systems Corporation | $ | 4,958 | $ | 18,313 | 9 | % | 40 | % | 35 | % | $ | 7,138 | $ | 13,198 | -17.17 | % | -4.49 | % | 17.15 | % | |||||||||||||||||||||
| Diebold, Incorporated | $ | 3,001 | $ | 2,239 | 8 | % | 8 | % | 8 | % | $ | 3,316 | $ | 1,890 | -13.09 | % | -5.44 | % | -0.06 | % | |||||||||||||||||||||
| DST Systems Inc. | $ | 2,710 | $ | 3,583 | 5 | % | 29 | % | 18 | % | $ | 1,557 | $ | 3,428 | -4.94 | % | 6.95 | % | 20.25 | % | |||||||||||||||||||||
| EchoStar Corp. | $ | 3,410 | $ | 4,811 | 5 | % | 35 | % | 21 | % | $ | 3,057 | $ | 4,845 | 31.40 | % | 1.11 | % | 19.67 | % | |||||||||||||||||||||
| Fidelity National Information Services, Inc. | $ | 6,305 | $ | 17,649 | 18 | % | 35 | % | 23 | % | $ | 9,241 | $ | 24,827 | 26.64 | % | 13.91 | % | 25.54 | % | |||||||||||||||||||||
| Fiserv, Inc. | $ | 5,013 | $ | 17,314 | 20 | % | 34 | % | 24 | % | $ | 5,505 | $ | 23,069 | 16.20 | % | 21.64 | % | 29.33 | % | |||||||||||||||||||||
| Harris Corporation | $ | 4,976 | $ | 7,512 | 5 | % | 29 | % | 11 | % | $ | 7,467 | $ | 12,735 | 20.71 | % | 16.43 | % | 26.57 | % | |||||||||||||||||||||
| Iron Mountain Inc. | $ | 3,109 | $ | 8,098 | 49 | % | 21 | % | 20 | % | $ | 3,511 | $ | 8,557 | 27.45 | % | 11.96 | % | 10.71 | % | |||||||||||||||||||||
| Lexmark International Inc. | $ | 3,694 | $ | 2,530 | 20 | % | 12 | % | 12 | % | |||||||||||||||||||||||||||||||
| NCR Corp. | $ | 6,493 | $ | 4,907 | –14 | % | 21 | % | 21 | % | $ | 6,543 | $ | 5,033 | 65.82 | % | 5.99 | % | 19.77 | % | |||||||||||||||||||||
| Pitney Bowes Inc. | $ | 3,822 | $ | 4,898 | 8 | % | 17 | % | 8 | % | $ | 3,407 | $ | 2,822 | -23.18 | % | -10.16 | % | 1.42 | % | |||||||||||||||||||||
| R.R. Donnelley & Sons Company | $ | 11,289 | $ | 3,358 | –12 | % | 14 | % | 1 | % | $ | 6,896 | $ | 1,139 | -16.87 | % | -12.00 | % | 2.54 | % | |||||||||||||||||||||
| Rockwell Automation Inc. | $ | 6,557 | $ | 15,083 | –4 | % | 17 | % | 21 | % | $ | 5,880 | $ | 17,300 | 34.44 | % | 6.86 | % | 15.50 | % | |||||||||||||||||||||
| Unisys Corporation | $ | 3,447 | $ | 1,472 | –12 | % | 14 | % | –5 | % | $ | 2,821 | $ | 749 | 35.29 | % | -23.63 | % | -5.38 | % | |||||||||||||||||||||
| The Western Union Company | $ | 5,619 | $ | 9,360 | 7 | % | 2 | % | 1 | % | $ | 5,423 | $ | 10,531 | 25.26 | % | 11.45 | % | 6.72 | % | |||||||||||||||||||||
| Xerox Corporation | $ | 21,142 | $ | 15,678 | 16 | % | 23 | % | 13 | % | $ | 10,771 | $ | 8,850 | -15.24 | % | -8.15 | % | 4.41 | % | |||||||||||||||||||||
| 25th Percentile | $3,428 | $3,470 | 3 | % | 14 | % | 8 | % | $ | 3,361 | $ | 3,125 | -14.17 | % | -6.80 | % | 3.47 | % | |||||||||||||||||||||||
| Median | $4,976 | $7,512 | 7 | % | 21 | % | 16 | % | $ | 5,505 | $ | 8,557 | 20.71 | % | 5.99 | % | 15.50 | % | |||||||||||||||||||||||
| 75th Percentile | $6,399 | $ | 15,381 | 17 | % | 31 | % | 21 | % | $ | 7,017 | $ | 12,966 | 29.42 | % | 11.70 | % | 20.01 | % | ||||||||||||||||||||||
| Pitney Bowes Inc. | $3,822 | $4,898 | 8 | % | 17 | % | 8 | % | $ | 3,407 | $ | 2,822 | -23.18 | % | -10.16 | % | 1.42 | % | |||||||||||||||||||||||
| PBI Percent Rank | 40% | 40 | % | 53 | % | 33 | % | 27 | % | ||||||||||||||||||||||||||||||||
| Source: Capital I.Q. | |||||||||||||||||||||||||||||||||||||||||
| PBI Percentile Rank | 29% | 21% | 0 | % | 14 | % | 14 | % | |||||||||||||||||||||||||||||||||
| Source: Capital I.Q. |
| (1) | Peer group as of December 31, 2016 used for benchmarking NEO peer median pay levels, conducting pay practice reviews and the calculation of the 2014-2016 TSR modifier. |
COMPENSATION DISCUSSION AND ANALYSIS
Other Policies and Guidelines
Clawback Policy
The company’s executive compensation programs include a “clawback” feature, allowing the board of directors to adjust, recoup or require the forfeiture of any awards made or paid under any stock planthe Stock Plan or the Key Employees Incentive Plan (KEIP) under the following circumstances:
| • | to any executive officer, including NEOs, in the event of any financial restatement due to a misrepresentation of the financial statements of the company. This applies to vesting or to payments made or paid during the 36-month period prior to the financial restatement; or | |
| • | to any employee, including NEOs, whom the board of directors reasonably believes engaged in gross misconduct or breached any provisions in their Proprietary Interest Protection Agreement, which generally provides for confidentiality, and non-competition and non-solicitation of employees and customers for one year following termination of employment. |
No Agreements with Executives
We have not entered into fixed term employment agreements with any of our NEOs, including the CEO. Therefore, such officers are “at will” employees.
No Pledging, Hedging and Other Short-term Speculative Trading
We have policies prohibiting both the pledging and hedging of our stock. Neither the board of directors nor management-level employees may pledge or transfer for value Pitney Bowes securities, engage in short-term speculative (“in and out”) trading in Pitney Bowes securities, or participate in hedging and other derivative transactions, including short sales, “put” or “call” options, swaps, collars or similar derivative transactions, with respect to Pitney Bowes securities (other than transactions in employee stock options).
Executive Stock Ownership Policy
We maintain an executive stock ownership policy that encourages executives to think as owners and to own substantial amounts of company stock to more closely align our key executives’ interests with the long-term interests of our stockholders.
The Committee reviewschart below illustrates the executive stockpolicy ownership policy annually to make sure it is in line with the policy’s objectives.requirements:
| Title | Stock Ownership as a Multiple of Base Salary |
| Chief Executive Officer | 5X |
| Chief Operating Officer | 3X |
| Other Executive Officers | 2X |
| Unit Presidents and Staff Vice Presidents | 1X |
Under the executive stock ownership policy the multiple of base salary ownership requirement for the CEO and other executive officers is 5X and 2X, respectively. Unit presidents and staff vice presidents are required to own 1X multiple of base salary. The policy was amended in 2014 to no longer count unvested RSUs, MSUs, PSUs and all option awards. Only shares owned outright, shares held in a trust and shares owned under a deferred compensation arrangement are counted toward the ownership requirement. Unvested shares and unexercised options do not count toward the ownership requirement.
Beginning with RSU and PSU awards made in February 2015, executives who are required to own certain levels of company stock under the executive stock ownership policy may elect to defer the settlement of RSUs and PSUs upon vesting until the executives terminate employment or retire. Executives who choose to defer in this manner receive dividend equivalents once the awards vest, which are also deferred as vested RSUs.
We calculateThe Committee reviews the number of shares targeted for retention by multiplying an executive’s annual base salary times the multiple of salary required and dividing by the average closing price of our common stock on the last trading day of each of the prior two calendar years.
The guidelines provide that the CEO and other executive officers have five years to achieve the required ownership levels from the date of the first award following the time they become covered by this policy or covered by an increased holding requirement. Until the CEO and other executive officers meet the required ownership levels, that executive is required to hold at least 75% of their “net profit shares” in the first five years, and 100% of the “net profit shares” thereafter.
Unit Presidents and Staff Vice Presidents must hold at least 50% of their “net profit shares” until the multiple is met. With respect to stock options, net profit shares are the shares remaining after the option is exercised, and, with respect to RSUs, PSUs and restricted stock, net profit shares are the shares remaining after vesting and payment of taxes. As long as the multiple of salary requirement is met, an executive may sell shares acquired previously in the market as well as shares acquired through the exercise of stock options or the vesting of equity awards, subject to normal trading restrictions. The company’s Stock Plan of 2013 allows executives subject to the stock ownership policy annually to defer settlement of RSUs and PSUs after vesting so that executives may achieve required ownership levels faster.make sure it is in line with the policy’s objectives.
COMPENSATION DISCUSSION AND ANALYSIS
Change of Control
We believe that the cash payments and benefit levels provided to our executives following a Change of Control transaction are consistent with current market practice for companies of our size. Our Change of Control arrangements are intended to encourage those executives most closely connected to a potential Change of Control to act more objectively, and therefore, in the best interests of our stockholders, despite the fact that such a transaction could result in the executives’ termination. Our Change of Control protections also encourage executives to remain with the company until the completion of the transaction to enable a successful transition. Accelerated vesting of equity awards and Change of Control severance payments occur only when an employee is terminated without cause or when an employee voluntarily terminates for good reason (such as a reduction in position, pay or other constructive termination event) within two years following a Change of Control (a “double trigger” payment mechanism). The Change of Control, by itself, does not cause severance payments or accelerated vesting of equity awards.
The company does not gross up its executives for any excise tax imposed on Change of Control payments.
Under the Senior Executive Severance Policy (SESP), NEOs are entitled to severance equal to two times the
sum of the participant’s current annual salary and the participant’s average annual incentive award in the preceding three calendar years in the event their employment is terminated on account of a Change of Control period.
A Change of Control is defined as (i) an acquisition of 30% or more of our common stock, or 30% or more of the combined voting power of our voting securities by an individual, entity or group, (ii) replacement of a majority of the board of directors other than as approved by the incumbent board, (iii) as a result of a reorganization, merger, consolidation or sale, more than 50% of our common stock and voting power changes hands, or (iv) approval by stockholders of a liquidation or dissolution of the company.
Our Change of Control arrangements fit into our overall compensation objectives because they are aligned with our goal of providing a compensation package sufficiently competitive to attract and retain talent and aligned with stockholder interests. With the double trigger payment mechanism applicable to both equity vesting and cash payouts and the lack of any gross-up, we believe the Change of Control arrangements are market leading from a corporate governance perspective.
Tax and Accounting
Our compensation programs are generally designed with the intent to satisfy the requirements for full deductibility under IRCCode Section 162(m). IRCSection 162(m) denies the company a tax deduction for certain compensation in excess of $1 million paid to “covered employees” unless theemployees,” but exempts from this $1 million cap compensation is qualifiedthat qualifies as performance-based compensation.compensation under Section 162(m). We generally structure our incentive compensation programs with the intention to be IRCqualify as performance-based compensation under Section 162(m) compliant.. However, the Committee weighs the benefits of compliance with IRCSection 162(m) against the potential limitations of such compliance, and may award compensation that may not be fully deductible if it determines that it is in the company’s best interest to do so. The rules and regulations promulgated under IRCCode Section 162(m) are complicated and subject to change from time to time, sometimes with retroactive effect. In addition, a number of requirements must be met in order for particular compensation to qualify. As such, there can be no assurance that any compensation awarded or paid by the company will be fully deductible under all circumstances.
Stock options are not currently granted as part ofwere re-introduced into the mix of long-term incentives however, special awards of stock options may be granted. In those cases wefor 2016. We value stock options based upon the Black-Scholes valuation method, consistent with the provisions of FASB Accounting Standards Codification Topic 718 (ASC 718). Key assumptions used to estimate the fair value of stock options include:
We also use a Monte-Carlo simulation, which is a generally accepted statistical technique, to value MSUs and PSUs. The technique simulates a range of possible future stock prices for the company. Key assumptions used to estimate the value of MSUs and PSUs include:
| • | the volatility of our stock price; | |
| • | the risk-free interest rate; | |
| • | expected term; and | |
| • | our dividend yield. |
TheFor PSUs awarded prior to 2016, we use a Monte-Carlo simulation, useswhich is a generally the same metrics as Black-Scholes, but calculates its ultimate result using an iterative method that generates many possible future stock price paths. We believe that the valuation techniques and the approaches utilizedaccepted statistical technique, to develop the underlying assumptions are appropriate in estimating the fair value of our stock option, PSU and MSU grants. Estimates of fair value are not intended to predict actual future events or the value ultimately realized by employees who receive equity awards, and subsequent events are not indicative of the reasonableness of the original estimates of fair value made by the company under ASC 718.PSUs.
In determining the number of PSUs to be awarded in the mix of long-term incentives for 2016, we value PSUs based upon the Monte-Carlo simulated valueclosing price of our common stock on the date of grant.grant date. In reporting the value of PSU grantsthese PSUs in the Summary Compensation Table, we discount the value of the PSUs shown represents the full value of the award based on a targeted number of shares multiplied by the Monte-Carlo value on the date of the award. The Monte-Carlo value also takes into
COMPENSATION DISCUSSION AND ANALYSIS
account thefor non-payment of dividends during the vesting period.period as required by accounting guidance under ASC 718.
In determining the number of RSUs to be awarded in the mix of long-term incentives, we value RSUs based upon the closing price of our common stock on the grant date. In reporting the value of RSUs in the Summary Compensation Table, we discount the value of the RSUs
for non-payment of dividends during the vesting period as required by accounting guidance under ASC 718.
For additional information on the accounting treatment for stock-based awards, see note 2019 to the financial statements included in our Annual Report on Form 10-K for the year ended December 31, 2014.2016.
| 51 |
COMPENSATION DISCUSSION AND ANALYSIS
Treatment of Special Events
In determining performance goals and evaluating enterprise performance results, the Committee may use its discretion and judgment to ensure that management’s rewards for business performance are commensurate with their contributions to that performance while still holding management accountable for the overall results of the business. The Committee believes that the metrics for incentive compensation plans should be specific and objective. However, in exercising its negative discretion, the Committee recognizes that interpretation of the application of pre-determined metrics to results may be necessary from time to time to better reflect the operating performance of the company’s business segments and take into account certain one-time events. In adopting its philosophy in establishing metrics and compensating the management team for its actual performance, the Committee believes it to be a fairer measure to remove the impact of certain events that may distort, either positively or negatively, the actual performance of management. The chart below explains the types of events that the Committee has taken into consideration in this regard.
Non-GAAP Measures
Non-GAAP measures should not be construed as an alternative to our reported results determined in accordance with Generally Accepted Accounting Principles (GAAP). Further, our definitions of these non-GAAP measures may differ from similarly titled measures used by other companies. We use measures such as adjusted earnings per share, adjusted free cash flow, adjusted income from continuing operations and adjusted earnings before interest and taxes to exclude the impact of special items like restructuring charges, asset impairments and tax adjustments, because, while these are actual income or expenses of ours, they can mask underlying trends associated with our business. Such items are often inconsistent in amount and frequency and, as such, the adjustments allow greater insight into the current underlying operating trends of the business.
Adjusted earnings per share and adjusted income from continuing operations provide greater insight into the current underlying operating trends of the business by excluding special items such as restructuring charges, asset impairments and tax adjustments.
FreeAdjusted free cash flow provides insight into the amount of cash that management could have available for other discretionary uses. It adjusts GAAP cash flow provided by operating activities for capital expenditures, as well as the cash impact of special items such as restructuring charges, unusual tax settlements or payments, and special pension contributions.contributions, and excludes the impact of finance receivables.
Management uses adjusted earnings before interest and taxes (EBIT) to measure profitability and performance.performance and is presented on a constant currency basis. EBIT is determined by deducting from revenue the related costs and expenses attributable to the segment. EBIT excludes interest and taxes, as well as special items such as restructuring charges and goodwill and asset impairments.
RevenueAdjusted revenue growth is presented on a constant currency basis and excludes the impact of disposals of certain business operations. Revenue growth is intended to provide a better understanding of the underlying operational performance of the business over the period.
COMPENSATION DISCUSSION AND ANALYSIS
Pitney Bowes Inc.
Reconciliation of Reported Consolidated Results to Adjusted Measures for Compensation
(Unaudited)
| (Dollars in thousands, except per share data) | 2014 | 2013(1) | 2012(1) | |||||||||
| GAAP diluted earnings per share from continuing operations, as reported | $ | 1.47 | $ | 1.42 | $ | 1.88 | ||||||
| Restructuring charges and asset impairments | 0.29 | 0.29 | 0.06 | |||||||||
| Extinguishment of debt | 0.19 | 0.10 | — | |||||||||
| Investment divestiture | (0.05 | ) | — | — | ||||||||
| Sale of leveraged lease assets | — | — | (0.06 | ) | ||||||||
| Diluted earnings per share from continuing operations(2) | 1.90 | 1.81 | 1.88 | |||||||||
| Adjustment for businesses sold(1) | — | 0.07 | 0.28 | |||||||||
| Investment divestiture | 0.05 | — | — | |||||||||
| Adjusted earnings per share(2) | $ | 1.95 | $ | 1.88 | $ | 2.16 | ||||||
| GAAP net cash provided by operating activities, as reported | $ | 655,526 | $ | 624,824 | $ | 660,188 | ||||||
| Capital expenditures | (180,556 | ) | (137,512 | ) | (176,586 | ) | ||||||
| Reserve account deposits | (15,666 | ) | (20,104 | ) | 1,636 | |||||||
| Restructuring payments | 56,162 | 59,520 | 74,718 | |||||||||
| Extinguishment of debt | 61,657 | 32,639 | — | |||||||||
| Net receipts related to investment divestiture | (5,737 | ) | — | — | ||||||||
| Tax and other payments on sale of businesses and leveraged lease assets | — | 75,545 | 114,128 | |||||||||
| Pension contribution | — | — | 95,000 | |||||||||
| Free cash flow | 571,386 | 634,912 | 769,084 | |||||||||
| Reserve account deposits | 15,666 | 20,104 | (1,636 | ) | ||||||||
| Net finance receivables(3) | (119,668 | ) | — | — | ||||||||
| Adjusted free cash flow | $ | 467,384 | $ | 655,016 | $ | 767,448 | ||||||
| GAAP income from continuing operations after income taxes, as reported | $ | 300,006 | $ | 287,612 | $ | 379,107 | ||||||
| Restructuring charges and asset impairments, after tax | 59,349 | 59,024 | 11,610 | |||||||||
| Extinguishment of debt, after tax. | 37,833 | 19,911 | — | |||||||||
| Investment divestiture, after tax. | (9,774 | ) | — | — | ||||||||
| Sale of leveraged lease assets, after tax | — | — | (12,886 | ) | ||||||||
| Income from continuing operations, as adjusted | 387,414 | 366,547 | 377,831 | |||||||||
| Adjustment for businesses sold(1) | — | 14,121 | 57,446 | |||||||||
| Adjusted income from continuing operations. | $ | 387,414 | $ | 380,668 | $ | 435,277 | ||||||
| GAAP income from continuing operations before income taxes, as reported | $ | 431,196 | $ | 383,954 | $ | 511,770 | ||||||
| Interest expense, net, before tax | 169,450 | 186,987 | 184,675 | |||||||||
| Restructuring charges and asset impairments, before tax. | 84,560 | 84,344 | 17,176 | |||||||||
| Extinguishment of debt, before tax | 61,657 | 32,639 | — | |||||||||
| Investment divestiture, before tax | (15,919 | ) | — | — | ||||||||
| Sale of leveraged lease assets, before tax | — | — | 3,817 | |||||||||
| Earnings before interest and taxes | 730,944 | 687,924 | 717,438 | |||||||||
| Impacts of foreign currency compared to budget(4) | 417 | 3,210 | — | |||||||||
| Adjustment for businesses sold(1) | — | 22,600 | 26,253 | |||||||||
| Adjusted earnings before interest and taxes. | $ | 731,361 | $ | 713,734 | $ | 743,691 | ||||||
| Reported revenue growth | 0.8% | (0.8% | ) | (5.1% | ) | |||||||
| Impacts of foreign currency | 0.4% | 0.3% | 1.1% | |||||||||
| Disposal of certain business operations(5) | 0.4% | 0.0% | 0.0% | |||||||||
| Revenue growth. | 1.6% | (0.5% | ) | (4.0% | ) | |||||||
| Adjustment for businesses sold(1) | 0.0% | (0.3% | ) | 0.6% | ||||||||
| Adjusted revenue growth | 1.6% | (0.8% | ) | (3.4% | ) |
| (Dollars in thousands, except per share data) | 2016 | 2015 | 2014 | |||||||||
| GAAP diluted earnings per share from continuing operations. | $ | 0.51 | $ | 2.00 | $ | 1.47 | ||||||
| Restructuring charges and asset impairments. | 0.22 | 0.09 | 0.29 | |||||||||
| Goodwill impairment | 0.89 | — | — | |||||||||
| Loss (gain) on sale/disposition of businesses | 0.02 | (0.42 | ) | — | ||||||||
| Acquisition and disposition transaction costs | — | 0.06 | — | |||||||||
| Preferred stock redemption | 0.03 | — | — | |||||||||
| Legal settlement | — | 0.02 | — | |||||||||
| Acquisition/disposition related expenses | — | 0.04 | — | |||||||||
| Investment divestiture | — | (0.04 | ) | (0.05 | ) | |||||||
| Extinguishment of debt | — | — | 0.19 | |||||||||
| Adjusted diluted earnings per share from continuing operations | 1.68 | 1.75 | 1.90 | |||||||||
| Investment divestiture | — | 0.04 | 0.05 | |||||||||
| Adjusted diluted earnings per share(1) | $ | 1.68 | $ | 1.79 | $ | 1.95 | ||||||
| GAAP net cash provided by operating activities | $ | 490,692 | $ | 515,056 | $ | 658,288 | ||||||
| Capital expenditures | (160,831 | ) | (166,746 | ) | (183,318 | ) | ||||||
| Restructuring payments | 64,930 | 62,086 | 56,162 | |||||||||
| Pension contribution | 36,731 | — | — | |||||||||
| Reserve account deposits | (2,183 | ) | (24,202 | ) | (15,666 | ) | ||||||
| Payments (receipts) related to investment divestiture | — | 20,602 | (5,737 | ) | ||||||||
| Acquisition/disposition related expenses | — | 10,483 | — | |||||||||
| Tax payment related to sale of Imagitas | — | 21,224 | — | |||||||||
| Cash transaction fees | 335 | 17,971 | — | |||||||||
| Extinguishment of debt | — | — | 61,657 | |||||||||
| Free cash flow | 429,674 | 456,474 | 571,386 | |||||||||
| Reserve account deposits | 2,183 | 24,202 | 15,666 | |||||||||
| Net finance receivables(2) | (119,883 | ) | (96,611 | ) | (119,668 | ) | ||||||
| Adjusted free cash flow before current year reclassifications | 311,974 | 384,065 | 467,384 | |||||||||
| Impact of current year reclassifications on prior year(3) | — | 1,270 | 1,766 | |||||||||
| Adjusted free cash flow | $ | 311,974 | $ | 385,335 | $ | 469,150 | ||||||
| GAAP net income | $ | 111,850 | $ | 426,318 | $ | 352,130 | ||||||
| Less: Preferred stock dividends attributable to noncontrolling interests | 19,045 | 18,375 | 18,375 | |||||||||
| Net (loss) income attributable to PBI | 92,805 | 407,943 | 333,755 | |||||||||
| Loss (income) from discontinued operations, net of tax | 2,701 | (5,271 | ) | (33,749 | ) | |||||||
| GAAP income from continuing operations after income taxes, as reported | 95,506 | 402,672 | 300,006 | |||||||||
| Restructuring charges and asset impairments. | 42,343 | 18,089 | 59,349 | |||||||||
| Goodwill impairment | 169,024 | — | — | |||||||||
| Preferred stock redemption | 6,430 | — | — | |||||||||
| Loss (gain) on sale/disposition of businesses | 3,893 | (84,250 | ) | — | ||||||||
| Acquisition and disposition transaction costs | 206 | 11,475 | — | |||||||||
| Legal settlement | — | 4,250 | — | |||||||||
| Acquisition related compensation expense | — | 7,246 | — | |||||||||
| Investment divestiture | — | (7,756 | ) | (9,774 | ) | |||||||
| Extinguishment of debt | — | — | 37,833 | |||||||||
| Adjusted income from continuing operations | 317,402 | 351,726 | 387,414 | |||||||||
| Preferred stock dividends attributable to noncontrolling interests, as adjusted. | 15,415 | 18,375 | 18,375 | |||||||||
| Provision for income taxes, as adjusted | 154,062 | 186,651 | 155,705 | |||||||||
| Interest expense, net. | 144,211 | 159,374 | 169,450 | |||||||||
| Adjusted earnings before interest and taxes | 631,090 | 716,126 | 730,944 | |||||||||
| Impacts of foreign currency compared to budget(4) | 7,010 | 22,353 | 417 | |||||||||
| Alignment of management to shareholders(5) | — | (21,639 | ) | — | ||||||||
| Adjusted earnings before interest and taxes | $ | 638,100 | $ | 716,840 | $ | 731,361 | ||||||
| Reported revenue growth | (4.8% | ) | (6.4% | ) | 0.8% | |||||||
| Impacts of foreign currency. | 1.0% | 3.5% | 0.4% | |||||||||
| Disposal of non-core businesses(6) | 0.5% | 0.0% | 0.4% | |||||||||
| Adjusted revenue growth | (3.2% | ) | (2.9% | ) | 1.6% | |||||||
| (1) | |
| The sum of the earnings per share amounts may not equal the totals | |
| Adjusted free cash flow excludes the impact of finance | |
| (3) | Adjustment to free cash flow due to reclassification of prior year finance receivable balances to conform to current year presentation that impacted the year over year change in finance receivables. |
| (4) | |
| rates. | |
| (5) | Adjusted earnings before interest and taxes excludes the impact of adjustments to performance-based accruals. |
| (6) | Adjusted revenue growth excludes the impact of the disposal of |
Executive Compensation Tables and Related Narrative
The following “Summary Compensation Table” shows all compensation earned by or paid to Messrs. Lautenbach, Monahan, Shearer, Goldstein,Guidotti, Pilc and Ms. Kohnstamm.Wright. The compensation shown below was paid for services performed during or with respect to 2014, 2013,2016, 2015, and 2012.2014. The “Summary Compensation Table” includes amounts earned and deferred during the periods covered under the Deferred Incentive Savings Plan.
The “Grants of Plan-Based Awards in 2014”2016” table on page 5956 provides additional information regarding grants made during 20142016 to the NEOs.
The “Stock Awards” and “Total” columns in the Summary Compensation Table (SCT) appear greater than historical amounts because of the company’s decision in 2014 to make its long-term incentive (LTI) plan 100% equity based. Last February, the Committee replaced cash incentive units (CIUs), payable in cash, with performance stock units (PSUs), settled in common stock. The new structure consists of 70% PSUs and 30% performance-based restricted stock units. Stock awards are reported in the SCT when granted, while cash awards are reported in the SCT under “Non-Equity Incentive Compensation” when paid. This creates a “bunching effect” making it appear as though the 2014 Stock Award and Total Amounts has comparatively increased from prior years, while in fact it only reflects the disparate manner in which equity and cash is required to be reported. This effect will continue through 2016 when all outstanding CIUs will be fully paid. See discussion on “bunching” in “Cash Incentive Units” on page 45 for additional details.
SUMMARY COMPENSATION TABLE
| Change in | |||||||||||||||||||||||||||||||||||||||||||||
| Pension Value | |||||||||||||||||||||||||||||||||||||||||||||
| and | |||||||||||||||||||||||||||||||||||||||||||||
| Non-Equity | Nonqualified | ||||||||||||||||||||||||||||||||||||||||||||
| Incentive | Deferred | ||||||||||||||||||||||||||||||||||||||||||||
| Stock | Option | Plan | Compensation | All Other | |||||||||||||||||||||||||||||||||||||||||
| Salary | Bonus | Awards | Awards | Compensation | Earnings | Compensation | |||||||||||||||||||||||||||||||||||||||
| Name and Principal Position | Year | Salary ($) | Bonus ($)(1) | Stock Awards ($)(2) | Option Awards ($)(3) | Non-Equity Incentive Plan Compensation ($)(4) | Change in Pension Value and Nonqualified Deferred Compensation Earnings ($)(5) | All Other Compensation ($)(6),(7) | Total ($) | Year | ($) | ($) | ($)(1) | ($)(2) | ($)(3) | ($)(4) | ($)(5) | Total ($)(6) | |||||||||||||||||||||||||||
| Marc B. Lautenbach | 2014 | 891,667 | — | 4,420,297 | — | 1,519,965 | — | 134,431 | 6,966,360 | 2016 | 950,000 | — | 3,876,808 | 1,100,001 | 0 | — | 115,240 | 6,042,049 | |||||||||||||||||||||||||||
| President and Chief | 2013 | 850,000 | — | 1,172,558 | 148,800 | 1,209,975 | — | 14,704 | 3,396,037 | 2015 | 941,667 | — | 4,902,597 | — | 4,787,025 | — | 166,424 | 10,797,713 | |||||||||||||||||||||||||||
| Executive Officer | 2012 | 70,833 | — | — | 289,300 | — | — | — | 360,133 | 2014 | 891,667 | — | 4,420,297 | — | 1,519,965 | — | 134,431 | 6,966,360 | |||||||||||||||||||||||||||
| Michael Monahan(8) | 2014 | 602,500 | — | 1,276,978 | — | 1,472,306 | 162,214 | 30,761 | 3,544,759 | ||||||||||||||||||||||||||||||||||||
| Executive Vice President | 2013 | 578,400 | — | 381,082 | 554,560 | 1,481,678 | 199,451 | 42,940 | 3,238,111 | ||||||||||||||||||||||||||||||||||||
| Michael Monahan | 2016 | 635,966 | — | 1,409,752 | 400,001 | 0 | 70,529 | 71,502 | 2,587,750 | ||||||||||||||||||||||||||||||||||||
| Executive Vice President, | 2015 | 622,503 | — | 1,961,039 | — | 1,639,102 | 81,973 | 89,184 | 4,393,801 | ||||||||||||||||||||||||||||||||||||
| Chief Operating Officer | 2014 | 602,500 | — | 1,276,978 | — | 1,472,306 | 162,214 | 30,761 | 3,544,759 | ||||||||||||||||||||||||||||||||||||
| and Chief Financial Officer | 2012 | 575,600 | — | 582,644 | — | 1,840,141 | 161,052 | 26,164 | 3,185,601 | ||||||||||||||||||||||||||||||||||||
| Mark L. Shearer | 2014 | 568,875 | — | 1,276,978 | — | 572,107 | — | 33,593 | 2,451,553 | 2016 | 583,083 | — | 916,336 | 260,001 | 0 | — | 62,312 | 1,821,731 | |||||||||||||||||||||||||||
| Executive Vice President | 2015 | 581,178 | 1,274,669 | — | 1,584,086 | — | 83,236 | 3,523,169 | |||||||||||||||||||||||||||||||||||||
| and President, Pitney Bowes | 2014 | 568,875 | — | 1,276,978 | — | 572,107 | — | 33,593 | 2,451,553 | ||||||||||||||||||||||||||||||||||||
| SMB Mailing Solutions | |||||||||||||||||||||||||||||||||||||||||||||
| Abby F. Kohnstamm | 2014 | 560,000 | 400,000 | 879,173 | — | 560,448 | — | 15,289 | 2,414,910 | ||||||||||||||||||||||||||||||||||||
| SMB Solutions | |||||||||||||||||||||||||||||||||||||||||||||
| Robert Guidotti | 2016 | 527,992 | — | 599,143 | 170,001 | 0 | — | 17,428 | 1,314,564 | ||||||||||||||||||||||||||||||||||||
| Executive Vice President | 2013 | 303,333 | 400,000 | 379,947 | — | 264,768 | — | 200,240 | 1,548,288 | ||||||||||||||||||||||||||||||||||||
| and Chief Marketing Officer | |||||||||||||||||||||||||||||||||||||||||||||
| Daniel J. Goldstein | 2014 | 489,335 | — | 638,476 | — | 801,337 | 40,038 | 34,014 | 2,003,200 | ||||||||||||||||||||||||||||||||||||
| and President, | |||||||||||||||||||||||||||||||||||||||||||||
| Pitney Bowes Software | |||||||||||||||||||||||||||||||||||||||||||||
| Roger Pilc | 2016 | 488,583 | — | 599,143 | 170,001 | 0 | — | 41,930 | 1,299,657 | ||||||||||||||||||||||||||||||||||||
| Executive Vice President | 2013 | 477,400 | — | 190,546 | — | 726,152 | — | 55,282 | 1,449,380 | ||||||||||||||||||||||||||||||||||||
| and Chief Legal & | |||||||||||||||||||||||||||||||||||||||||||||
| Compliance Officer | |||||||||||||||||||||||||||||||||||||||||||||
| and Chief Innovation Officer | |||||||||||||||||||||||||||||||||||||||||||||
| Mark F. Wright(7) | 2016 | 262,070 | — | 528,659 | 150,001 | 0 | — | 461,556 | 1,402,286 | ||||||||||||||||||||||||||||||||||||
| former Executive | 2015 | 518,500 | — | 735,395 | — | 938,408 | — | 52,036 | 2,244,339 | ||||||||||||||||||||||||||||||||||||
| Vice President and President, | 2014 | 508,333 | — | 930,745 | — | 382,806 | — | 25,681 | 1,847,565 | ||||||||||||||||||||||||||||||||||||
| Strategic Growth Initiatives | |||||||||||||||||||||||||||||||||||||||||||||
| (1) | |
| This column includes the value of stock awarded to NEOs during |
EXECUTIVE COMPENSATION TABLES AND RELATED NARRATIVE
| This column includes the value of stock options awarded to NEOs during | |
| See page 44 in “Compensation Discussion and Analysis” for additional information on NSOs. | |
| This column includes annual incentive compensation earned in 2016, 2015 and 2014, and Cash Incentive Unit (CIU) payouts earned over the 2012-2014 and 2013-2015 award cycles. In Messrs. Lautenbach’s, Shearer’s and Wright’s cases, the reason for the increase in Non-Equity Incentive Plan compensation in 2015 versus 2014 is that 2015 was the first year each received a CIU payout, whereas in prior years, only annual incentive payouts were reflected. In Mr. Monahan’s case, the difference in 2015 versus 2014 merely reflects the variation in annual incentive and CIU payout. The 2013-2015 CIU payout represented the final cycle, as the award was replaced with PSUs beginning in 2014. When considering all elements of the table above, the majority of compensation for the NEOs is at-risk and is earned based on company and executive performance against pre-determined financial objectives. | |
| each NEO. | |
| This column shows the change in the actuarial present value of the accumulated pension benefit applicable to all eligible employees during |
| 54 |
EXECUTIVE COMPENSATION TABLES AND RELATED NARRATIVE
| Amounts shown for For For Mr. Monahan, 2016 includes: company match of $10,600 and 2% core contribution of $5,300 to the Pitney Bowes 401(k) Plan, For Mr. Shearer, 2016 includes: company match of $10,600 and 2% core contribution of $5,300 to the Pitney Bowes 401(k) Plan, company match of $20,694 and 2% core contribution of $11,679 to the Pitney Bowes 401(k) Restoration Plan earned in For Mr. Guidotti, 2016 includes: financial counseling of $13,389, executive physical of $2,200, the company’s actual cost for spousal travel and group term life insurance premium provided by the company in excess of $50,000. For Mr. Pilc, 2016 includes: company match of $10,600 and 2% core contribution of $5,300 to the Pitney Bowes 401(k) Plan, company match of $15,350 and 2% core contribution of $8,747 to the Pitney Bowes 401(k) Restoration Plan earned in For Mr. Wright, 2016 includes: $416,160 in severance and other related payments, company match of $10,600 and 2% core contribution of $5,300 to the Pitney Bowes 401(k) Plan, | |
| (6) | The amounts in the “Total” column in the Summary Compensation Table (SCT) below makes year-over-year compensation comparisons difficult. SEC rules require cash awards to be reported when paid, and stock awards to be reported when granted. In 2014 compensation for Mr. Monahan, and in 2015 compensation for Messrs. Lautenbach, Monahan, Shearer and Wright, both the payout of the long-term cash incentive awarded three years prior and the stock grant awarded in that year are reported in the same year, creating a bunching effect. |
| (7) | |
EXECUTIVE COMPENSATION TABLES AND RELATED NARRATIVE
GRANTS OF PLAN-BASED AWARDS IN 20142016
| Estimated Future Payouts Under Non-Equity Incentive Plan Awards | Estimated Future Payouts Under Equity Incentive Plan Awards | Grant Date Fair | |||||||||||||||||||||
| Name | Grant Date | Threshold ($) | Target ($) | Maximum(1) ($) | Threshold (#) | Target (#) | Maximum (#) | Value of Stock and Option Awards(2) | |||||||||||||||
| Marc B. Lautenbach | |||||||||||||||||||||||
| (Annual Incentive)(3) | 212,625 | 1,215,000 | 4,000,000 | ||||||||||||||||||||
| (Performance Stock Units)(4) | 2/10/2014 | 3,105 | 125,448 | 250,896 | 3,149,999 | ||||||||||||||||||
| (Performance-based RSUs)(5) | 2/10/2014 | 53,849 | 1,270,298 | ||||||||||||||||||||
| Michael Monahan | |||||||||||||||||||||||
| (Annual Incentive)(3) | 85,025 | 485,856 | 4,000,000 | ||||||||||||||||||||
| (Performance Stock Units)(4) | 2/10/2014 | 897 | 36,241 | 72,482 | 910,012 | ||||||||||||||||||
| (Performance-based RSUs)(5) | 2/10/2014 | 15,556 | 366,966 | ||||||||||||||||||||
| Mark L. Shearer | |||||||||||||||||||||||
| (Annual Incentive)(3) | 80,031 | 457,320 | 4,000,000 | ||||||||||||||||||||
| (Performance Stock Units)(4) | 2/10/2014 | 897 | 36,241 | 72,482 | 910,012 | ||||||||||||||||||
| (Performance-based RSUs)(5) | 2/10/2014 | 15,556 | 366,966 | ||||||||||||||||||||
| Abby F. Kohnstamm | |||||||||||||||||||||||
| (Annual Incentive)(3) | 78,400 | 448,000 | 4,000,000 | ||||||||||||||||||||
| (Performance Stock Units)(4) | 2/10/2014 | 345 | 13,939 | 27,878 | 350,008 | ||||||||||||||||||
| (Performance-based RSUs)(5) | 2/10/2014 | 5,983 | 141,139 | ||||||||||||||||||||
| (Performance-based RSUs)(6) | 2/10/2014 | 15,955 | 388,026 | ||||||||||||||||||||
| Daniel J. Goldstein | |||||||||||||||||||||||
| (Annual Incentive)(3) | 51,631 | 295,033 | 4,000,000 | ||||||||||||||||||||
| (Performance Stock Units)(4) | 2/10/2014 | 448 | 18,120 | 36,240 | 454,993 | ||||||||||||||||||
| (Performance-based RSUs)(5) | 2/10/2014 | 7,778 | 183,483 | ||||||||||||||||||||
| All Other | All Other | Grant | ||||||||||||||||
| Stock | Option | Exercise | Date Fair | |||||||||||||||
| Estimated Future | Estimated Future | Awards: | Awards: | or Base | Value of | |||||||||||||
| Payouts Under Non-Equity | Payouts Under Equity | Number of | Number of | Price of | Stock and | |||||||||||||
| Incentive Plan Awards | Incentive Plan Awards | Shares of | Securities | Option | Option | |||||||||||||
| Grant | Threshold | Target | Maximum | Threshold | Target | Maximum | Stock or | Underlying | Awards | Awards(1) | ||||||||
| Name | Date | ($) | ($) | ($) | (#) | (#) | (#) | Units(#) | Options(#) | ($/Sh) | ($) | |||||||
| Marc B. Lautenbach | ||||||||||||||||||
| (Annual Incentive)(2) | 224,438 | 1,282,500 | 4,000,000 | |||||||||||||||
| (Performance Stock Units)(3) | 2/8/2016 | 19,620 | 196,195 | 392,390 | 2,872,295 | |||||||||||||
| (Performance-based RSUs)(4) | 2/8/2016 | 65,398 | 1,004,513 | |||||||||||||||
| (Nonqualified Stock Options)(5) | 2/8/2016 | 388,693 | 16.82 | 1,100,001 | ||||||||||||||
| Michael Monahan | ||||||||||||||||||
| (Annual Incentive)(2) | 100,493 | 574,246 | 4,000,000 | |||||||||||||||
| (Performance Stock Units)(3) | 2/8/2016 | 7,134 | 71,344 | 142,688 | 1,044,476 | |||||||||||||
| (Performance-based RSUs)(4) | 2/8/2016 | 23,781 | 365,276 | |||||||||||||||
| (Nonqualified Stock Options)(5) | 2/8/2016 | 141,343 | 16.82 | 400,001 | ||||||||||||||
| Mark L. Shearer | ||||||||||||||||||
| (Annual Incentive)(2) | 81,632 | 466,466 | 4,000,000 | |||||||||||||||
| (Performance Stock Units)(3) | 2/8/2016 | 4,637 | 46,373 | 92,746 | 678,901 | |||||||||||||
| (Performance-based RSUs)(4) | 2/8/2016 | 15,458 | 237,435 | |||||||||||||||
| (Nonqualified Stock Options)(5) | 2/8/2016 | 91,873 | 16.82 | 260,001 | ||||||||||||||
| Robert Guidotti | ||||||||||||||||||
| (Annual Incentive)(2) | 55,650 | 318,000 | 4,000,000 | |||||||||||||||
| (Performance Stock Units)(3) | 2/8/2016 | 3,032 | 30,321 | 60,642 | 443,899 | |||||||||||||
| (Performance-based RSUs)(4) | 2/8/2016 | 10,107 | 155,244 | |||||||||||||||
| (Nonqualified Stock Options)(5) | 2/8/2016 | 60,071 | 16.82 | 170,001 | ||||||||||||||
| Roger Pilc | ||||||||||||||||||
| (Annual Incentive)(2) | 51,587 | 294,780 | 4,000,000 | |||||||||||||||
| (Performance Stock Units)(3) | 2/8/2016 | 3,032 | 30,321 | 60,642 | 443,899 | |||||||||||||
| (Performance-based RSUs)(4) | 2/8/2016 | 10,107 | 155,244 | |||||||||||||||
| (Nonqualified Stock Options)(5) | 2/8/2016 | 60,071 | 16.82 | 170,001 | ||||||||||||||
| Mark F. Wright | ||||||||||||||||||
| (Annual Incentive)(2) | 54,621 | 312,120 | 4,000,000 | |||||||||||||||
| (Performance Stock Units)(3) | 2/8/2016 | 2,675 | 26,754 | 53,508 | 391,679 | |||||||||||||
| (Performance-based RSUs)(4) | 2/8/2016 | 8,918 | 136,980 | |||||||||||||||
| (Nonqualified Stock Options)(5) | 2/8/2016 | 53,004 | 16.82 | 150,001 | ||||||||||||||
The Grants of Plan-Based awards table captures the potential threshold, target and maximum award payouts for annual incentive, performance stock units (PSUs), performance-based restricted stock units (RSUs) and performance-based RSUs.nonqualified stock options (NSOs).
| (1) | |
| The amounts in this column represent the grant date fair values of PSU, RSU and | |
| $2.83, respectively. | |
| Values in this row represent the range in | |
| No annual incentive was paid for 2016 as the Company fell short of the financial objectives established for the year. | |
| PSUs were granted based on the | |
| Performance-based RSUs were granted based on the actual closing price of $16.82 on the February | |
| 12, 2019. | |
Stock Awards
EXECUTIVE COMPENSATION TABLES AND RELATED NARRATIVE
performance during the three-year performance period and the estimated number of performance based RSUs that may vest based on performance. For performance based RSUs granted to all NEOs, a performance metric tied to adjusted income from continuing operations was met as of December 31, 2014. The awards remain subject to forfeiture over the remaining vesting period. The vesting of the PSUs is subject to achievement of the predetermined annual performance metrics, a three-year cumulative total shareholder return modifier, and a three-year cumulative average income from continuing operations objective. The Committee may apply negative discretion to reduce long-term awards such that payments are in line with financial enterprise performance. See page 59 (“Grants of Plan-Based Awards in 2014”).
Option Awards
Non-Equity Incentive Plan Compensation
Change in Pension Value and Nonqualified Deferred Compensation Earnings
All Other Compensation
Equity Awards
EXECUTIVE COMPENSATION TABLES AND RELATED NARRATIVE
OUTSTANDING EQUITY AWARDS AT 20142016 FISCAL YEAR-END
The following table provides information on the current holdings of stock option and stock awards by the NEOs. This table includes unexercised or unvested option awards, unvested RSUs PSUs and MSUs.PSUs. Each equity grant is shown separately for each NEO. The vesting schedule for each outstanding award is shown following this table(1). For additional information about the stock option and stock awards, see the description of equity incentive compensation in “Compensation Discussion and Analysis” beginning on page 32.42.
| Option Awards | Stock Awards | ||||||||||||||||||||||||||||||||||||||||||||||||||||||||||||||
| Equity | |||||||||||||||||||||||||||||||||||||||||||||||||||||||||||||||
| Equity | Incentive | ||||||||||||||||||||||||||||||||||||||||||||||||||||||||||||||
| Incentive | Plan Awards: | ||||||||||||||||||||||||||||||||||||||||||||||||||||||||||||||
| Plan Awards: | Market or | ||||||||||||||||||||||||||||||||||||||||||||||||||||||||||||||
| Option Awards | Stock Awards | Number | Market Value | Number | Payout Value | ||||||||||||||||||||||||||||||||||||||||||||||||||||||||||
| Equity | Number of | Number of | of Shares | of Shares | of Unearned | of Unearned | |||||||||||||||||||||||||||||||||||||||||||||||||||||||||
| Equity | Incentive | Securities | Securities | or Units | or Units | Shares, Units | Shares, Units | ||||||||||||||||||||||||||||||||||||||||||||||||||||||||
| Incentive | Plan Awards: | Underlying | Underlying | Option | of Stock | of Stock | or Other Rights | or Other Rights | |||||||||||||||||||||||||||||||||||||||||||||||||||||||
| Plan Awards: | Market or | Unexercised | Unexercised | Exercise | Option | That Have | That Have | That Have | That Have | ||||||||||||||||||||||||||||||||||||||||||||||||||||||
| Number | Market Value | Number | Payout Value | Options (#) | Options (#) | Price | Expiration | Not Vested | Not Vested | Not Vested | Not Vested | ||||||||||||||||||||||||||||||||||||||||||||||||||||
| Name | Grant Date | Number of Securities Underlying Unexercised Options (#) Exercisable | Number of Securities Underlying Unexercised Options (#) Unexercisable | Option Exercise Price ($) | Option Expiration Date | Unrealized Appreciation ($)(2) | of Shares or Units of Stock That Have Not Vested (#) | of Shares or Units of Stock That Have Not Vested ($)(3) | of Unearned Shares, Units or Other Rights That Have Not Vested (#) | of Unearned Shares, Units or Other Rights That Have Not Vested ($)(3) | Grant Date | Exercisable | Unexercisable | ($) | Date | (#) | ($)(2) | (#) | ($)(2) | ||||||||||||||||||||||||||||||||||||||||||||
| Marc B. Lautenbach | 12/3/2012 | 50,000 | 50,000 | 13.3860 | 12/3/2022 | 1,098,400 | — | — | — | — | 12/3/2012 | 100,000 | 0 | 13.3860 | 12/3/2022 | — | — | — | — | ||||||||||||||||||||||||||||||||||||||||||||
| 12/3/2012 | 200,000 | 0 | 15.1320 | 12/3/2022 | — | — | — | — | |||||||||||||||||||||||||||||||||||||||||||||||||||||||
| 12/3/2012 | 300,000 | 0 | 16.8780 | 12/3/2022 | — | — | — | — | |||||||||||||||||||||||||||||||||||||||||||||||||||||||
| 2/11/2013 | 400,000 | 0 | 22.1600 | 12/2/2022 | — | — | — | — | |||||||||||||||||||||||||||||||||||||||||||||||||||||||
| 2/11/2013 | — | — | — | — | 28,881 | 438,702 | — | — | |||||||||||||||||||||||||||||||||||||||||||||||||||||||
| 2/10/2014 | — | — | — | — | 17,951 | 272,676 | — | — | |||||||||||||||||||||||||||||||||||||||||||||||||||||||
| 12/3/2012 | 100,000 | 100,000 | 15.1320 | 12/3/2022 | 1,847,600 | — | — | — | — | 2/10/2014 | — | — | — | — | — | — | 70,251 | 1,067,111 | |||||||||||||||||||||||||||||||||||||||||||||
| 12/3/2012 | 150,000 | 150,000 | 16.8780 | 12/3/2022 | 2,247,600 | — | — | — | — | 2/9/2015 | — | — | — | — | 44,170 | 670,942 | — | — | |||||||||||||||||||||||||||||||||||||||||||||
| 2/11/2013 | 200,000 | 200,000 | 22.1600 | 12/2/2022 | 884,000 | — | — | — | — | 2/9/2015 | — | — | — | — | — | — | 29,619 | 449,915 | |||||||||||||||||||||||||||||||||||||||||||||
| 2/11/2013 | — | — | — | — | — | 86,642 | 2,111,466 | — | — | 2/8/2016 | ��� | 388,693 | 16.8200 | 2/7/2026 | — | — | — | — | |||||||||||||||||||||||||||||||||||||||||||||
| 2/10/2014 | — | — | — | — | — | 53,849 | 1,312,300 | — | — | 2/8/2016 | — | — | — | — | 65,398 | 993,396 | — | — | |||||||||||||||||||||||||||||||||||||||||||||
| 2/10/2014 | — | — | — | — | — | — | — | 237,097 | 5,778,047 | 2/8/2016 | — | — | — | — | — | — | 196,195 | 2,980,202 | |||||||||||||||||||||||||||||||||||||||||||||
| Michael Monahan | 2/14/2005 | 26,000 | 0 | 46.9300 | 2/13/2015 | 0 | — | — | — | — | 2/12/2007 | 28,777 | 0 | 48.0300 | 2/11/2017 | — | — | — | — | ||||||||||||||||||||||||||||||||||||||||||||
| 2/13/2006 | 28,050 | 0 | 42.6200 | 2/12/2016 | 0 | — | — | — | — | 2/11/2008 | 153,846 | 0 | 36.9600 | 2/10/2018 | — | — | — | — | |||||||||||||||||||||||||||||||||||||||||||||
| 2/12/2007 | 28,777 | 0 | 48.0300 | 2/11/2017 | 0 | — | — | — | — | 2/9/2009 | 90,461 | 0 | 24.7500 | 2/8/2019 | — | — | — | — | |||||||||||||||||||||||||||||||||||||||||||||
| 2/11/2008 | 153,846 | 0 | 36.9600 | 2/10/2018 | 0 | — | — | — | — | 2/8/2010 | 106,383 | 0 | 22.0900 | 2/7/2020 | — | — | — | — | |||||||||||||||||||||||||||||||||||||||||||||
| 2/9/2009 | 90,461 | 0 | 24.7500 | 2/8/2019 | 0 | — | — | — | — | 2/14/2011 | 94,203 | 0 | 26.0700 | 2/13/2021 | — | — | — | — | |||||||||||||||||||||||||||||||||||||||||||||
| 2/8/2010 | 106,383 | 0 | 22.0900 | 2/7/2020 | 242,553 | — | — | — | — | 2/11/2013 | — | — | — | — | 9,386 | 142,573 | — | — | |||||||||||||||||||||||||||||||||||||||||||||
| 2/14/2011 | 94,203 | 0 | 26.0700 | 2/13/2021 | 0 | — | — | — | — | 7/1/2013 | 26,666 | 13,334 | 17.2000 | 6/30/2023 | — | — | — | — | |||||||||||||||||||||||||||||||||||||||||||||
| 2/14/2011 | — | — | — | — | — | 3,116 | 75,937 | — | — | 7/1/2013 | 53,333 | 26,667 | 19.4500 | 6/30/2023 | — | — | — | — | |||||||||||||||||||||||||||||||||||||||||||||
| 2/13/2012 | — | — | — | — | — | 8,793 | 214,285 | — | — | 7/1/2013 | 80,000 | 40,000 | 21.6900 | 6/30/2023 | — | — | — | — | |||||||||||||||||||||||||||||||||||||||||||||
| 2/13/2012 | — | — | — | — | — | — | — | 18,146 | 442,218 | 7/1/2013 | 106,666 | 53,334 | 23.9400 | 6/30/2023 | — | — | — | — | |||||||||||||||||||||||||||||||||||||||||||||
| 2/11/2013 | — | — | — | — | — | 28,159 | 686,235 | — | — | 2/10/2014 | — | — | — | — | 5,186 | 78,775 | — | — | |||||||||||||||||||||||||||||||||||||||||||||
| 7/1/2013 | — | 40,000 | 17.2000 | 6/30/2023 | 286,800 | — | — | — | — | 2/10/2014 | — | — | — | — | — | — | 20,295 | 308,280 | |||||||||||||||||||||||||||||||||||||||||||||
| 7/1/2013 | — | 80,000 | 19.4500 | 6/30/2023 | 393,600 | — | — | — | — | 2/9/2015 | — | — | — | — | 17,668 | 268,377 | — | — | |||||||||||||||||||||||||||||||||||||||||||||
| 7/1/2013 | — | 120,000 | 21.6900 | 6/30/2023 | 321,600 | — | — | — | — | 2/9/2015 | — | — | — | — | — | — | 11,848 | 179,965 | |||||||||||||||||||||||||||||||||||||||||||||
| 7/1/2013 | — | 160,000 | 23.9400 | 6/30/2023 | 68,800 | — | — | — | — | 2/8/2016 | — | 141,343 | 16.8200 | 2/7/2026 | — | — | — | — | |||||||||||||||||||||||||||||||||||||||||||||
| 2/10/2014 | — | — | — | — | — | 15,556 | 379,100 | — | — | 2/8/2016 | — | — | — | — | 23,781 | 361,233 | — | — | |||||||||||||||||||||||||||||||||||||||||||||
| 2/10/2014 | — | — | — | — | — | — | — | 68,495 | 1,669,235 | 2/8/2016 | — | — | — | — | — | — | 71,344 | 1,083,715 | |||||||||||||||||||||||||||||||||||||||||||||
| Mark L. Shearer | 5/1/2013 | — | — | — | — | — | 27,311 | 665,569 | — | — | 5/1/2013 | — | — | — | — | 9,104 | 138,290 | — | — | ||||||||||||||||||||||||||||||||||||||||||||
| 2/10/2014 | — | — | — | — | — | 15,556 | 379,100 | — | — | 2/10/2014 | — | — | — | — | 5,186 | 78,775 | — | — | |||||||||||||||||||||||||||||||||||||||||||||
| 2/10/2014 | — | — | — | — | — | — | — | 68,495 | 1,669,235 | 2/10/2014 | — | — | — | — | — | — | 20,295 | 308,280 | |||||||||||||||||||||||||||||||||||||||||||||
| Abby F. Kohnstamm | 2/10/2014 | — | — | — | — | — | 5,983 | 145,806 | — | — | |||||||||||||||||||||||||||||||||||||||||||||||||||||
| 2/10/2014 | — | — | — | — | — | 15,955 | 388,823 | — | — | 2/9/2015 | — | — | — | — | 11,484 | 174,442 | — | — | |||||||||||||||||||||||||||||||||||||||||||||
| 2/10/2014 | — | — | — | — | — | — | — | 26,345 | 642,021 | 2/9/2015 | — | — | — | — | — | — | 7,701 | 116,977 | |||||||||||||||||||||||||||||||||||||||||||||
| Daniel J. Goldstein | 2/14/2011 | 39,855 | — | 26.0700 | 2/13/2021 | 0 | — | — | — | — | |||||||||||||||||||||||||||||||||||||||||||||||||||||
| 2/8/2016 | — | 91,873 | 16.8200 | 2/7/2026 | — | — | — | — | |||||||||||||||||||||||||||||||||||||||||||||||||||||||
| 2/8/2016 | — | — | — | — | 15,458 | 234,807 | — | — | |||||||||||||||||||||||||||||||||||||||||||||||||||||||
| 2/8/2016 | — | — | — | — | — | — | 46,373 | 704,406 | |||||||||||||||||||||||||||||||||||||||||||||||||||||||
| Robert Guidotti | 2/8/2016 | — | 60,071 | 16.8200 | 2/7/2026 | — | — | — | — | ||||||||||||||||||||||||||||||||||||||||||||||||||||||
| 2/8/2016 | — | — | — | — | 10,107 | 153,525 | — | — | |||||||||||||||||||||||||||||||||||||||||||||||||||||||
| 2/8/2016 | — | — | — | — | — | — | 30,321 | 460,576 | |||||||||||||||||||||||||||||||||||||||||||||||||||||||
| Roger Pilc | 6/3/2013 | — | — | — | — | 3,460 | 52,557 | — | — | ||||||||||||||||||||||||||||||||||||||||||||||||||||||
| 2/14/2011 | — | — | — | — | — | 1,318 | 32,120 | — | — | 2/10/2014 | — | — | — | — | 1,995 | 30,304 | — | — | |||||||||||||||||||||||||||||||||||||||||||||
| 2/13/2012 | — | — | — | — | — | 4,396 | 107,131 | — | — | 2/10/2014 | — | — | — | — | — | — | 7,806 | 118,571 | |||||||||||||||||||||||||||||||||||||||||||||
| 2/13/2012 | — | — | — | — | — | — | — | 9,073 | 221,109 | 2/9/2015 | — | — | — | — | 5,301 | 80,522 | — | — | |||||||||||||||||||||||||||||||||||||||||||||
| 2/11/2013 | — | — | — | — | — | 14,080 | 343,130 | — | — | 2/9/2015 | — | — | — | — | — | — | 3,554 | 53,990 | |||||||||||||||||||||||||||||||||||||||||||||
| 2/10/2014 | — | — | — | — | — | 7,778 | 189,550 | — | — | 2/8/2016 | — | 60,071 | 16.8200 | 2/7/2026 | — | — | — | — | |||||||||||||||||||||||||||||||||||||||||||||
| 2/10/2014 | — | — | — | — | — | — | — | 34,247 | 834,595 | 2/8/2016 | — | — | — | — | 10,107 | 153,525 | — | — | |||||||||||||||||||||||||||||||||||||||||||||
| (Table continued on next page) | |||||||||||||||||||||||||||||||||||||||||||||||||||||||||||||||
| 2/8/2016 | — | — | — | — | — | — | 30,321 | 460,576 | |||||||||||||||||||||||||||||||||||||||||||||||||||||||
| Mark F. Wright(3) | 2/10/2014 | — | — | — | — | — | — | 9,757 | 148,207 | ||||||||||||||||||||||||||||||||||||||||||||||||||||||
| 2/9/2015 | — | — | — | — | — | — | 2,221 | 33,743 | |||||||||||||||||||||||||||||||||||||||||||||||||||||||
| 2/8/2016 | — | — | — | — | — | — | 4,459 | 67,732 | |||||||||||||||||||||||||||||||||||||||||||||||||||||||
(Table continued on next page)
EXECUTIVE COMPENSATION TABLES AND RELATED NARRATIVE
| (1) | Option and Stock Awards Vesting Schedule |
| Grant Date | Award Type | Name of Executive | Vesting Schedule | |||
| 2/ | RSU | Lautenbach, Monahan | Four year vesting; 25% remains unvested; | |||
| 5/1/2013 | RSU | Shearer | Four year vesting; | |||
| 6/3/2013 | RSU | Pilc | Four year vesting; 25% remains unvested; 25% vests on February 7, 2017 | |||
| 7/1/2013 | Monahan | Three year vesting; | ||||
| 2/10/2014 | PSU | Lautenbach, Monahan, Shearer, | Three year cliff vesting; 100% vests on February 7, 2017 | |||
| 2/10/2014 | RSU | Lautenbach, Monahan, Shearer, | Three year vesting; 33% remains unvested; 33% vests on February 7, 2017 | |||
| 2/9/2015 | PSU | Lautenbach, Monahan, Shearer, Pilc, Wright | Three year cliff vesting; 100% vests on February 13, 2018 | |||
| 2/9/2015 | RSU | Lautenbach, Monahan, Shearer, Pilc | Three year vesting; 66% remains unvested; 33% vests on February 14, 2017 and 33% vests on February 13, 2018 | |||
| 2/8/2016 | NSO | Lautenbach, Monahan, Shearer, Guidotti, Pilc | Three year vesting; 100% remains unvested; 33% | |||
| 2/ | RSU |
| 2/8/2016 | PSU | ||
| Lautenbach, Monahan, Shearer, Guidotti, Pilc, Wright | Three year cliff vesting; 100% vests on February 12, 2019 |
| (2) | |
| These amounts were calculated based on the closing price of the company’s common stock of |
| (3) | Mr. Wright’s outstanding PSU awards are prorated based on his date of termination from the Company, July 1, 2016. |
EXECUTIVE COMPENSATION TABLES AND RELATED NARRATIVE
OPTION EXERCISES AND STOCK VESTED DURING 20142016 FISCAL YEAR(1)
| Option Awards | Stock Awards | Option Awards | Stock Awards | |||||||||||||
| Number of | Number of | Number of | Number of | |||||||||||||
| Shares Acquired | Value Realized | Shares Acquired | Value Realized | Shares Acquired | Value Realized | Shares Acquired | Value Realized | |||||||||
| Name | on Exercise (#) | on Exercise ($) | on Vesting (#)(1) | on Vesting ($) | on Exercise (#) | on Exercise ($) | on Vesting (#) | on Vesting ($)(1) | ||||||||
| Marc B. Lautenbach | 0 | 0 | 28,881 | 714,516 | (2) | 0 | 68,913(2) | 1,179,995 | ||||||||
| Michael Monahan | 0 | 0 | 20,295 | 502,098 | (2) | 0 | 27,802(3) | 476,090 | ||||||||
| Mark L. Shearer | 0 | 0 | 9,104 | 225,233 | (2) | 0 | 20,030(4) | 343,305 | ||||||||
| Abby F. Kohnstamm | 0 | 0 | 26,738 | 736,365 | (3) | |||||||||||
| Daniel J. Goldstein | 0 | 0 | 12,849 | 317,884 | (2) | |||||||||||
| Robert Guidotti | 0 | N/A | ||||||||||||||
| Roger Pilc | 0 | 8,104(5) | 138,739 | |||||||||||||
| Mark F. Wright | 0 | 26,426(6) | 462,900 | |||||||||||||
| (1) | |
| These values were determined based on the average of the high and low trading price of $17.28 on the February | |
| (2) | Performance-based RSUs granted on February 11, 2013 and February 10, 2014 had a pro-rata vesting on February 2, 2016. Performance-based RSUs granted on February 9, 2015 had a pro-rata vesting on February 9, 2016. The figures reported for Mr. Lautenbach also includes 21,320 deferred RSUs from the 2015 grant, the receipt of which has been deferred until six months following termination or retirement from the Company. Figures reported include shares withheld to cover taxes. |
| (3) | |
| (4) | Performance-based RSUs granted on May 1, 2013 and February 10, 2014 had a pro-rata vesting on February 2, 2016. Performance-based RSUs granted on February 9, 2015 had a pro-rata vesting on February 9, 2016. |
| (5) | Performance-based RSUs granted on June 3, 2013 and February 10, 2014 had a pro-rata vesting on February 2, 2016. Performance-based RSUs granted on February 9, 2015 had a pro-rata vesting on February 9, 2016. |
| (6) | Performance-based RSUs granted on May 1, 2013 and February 10, 2014 had a pro-rata vesting on February 2, 2016 and July 1, |
Pension Benefits
The following table provides information regarding pension payments to the NEOs. It includes data regarding the Pitney Bowes Pension Plan and the Pension Restoration Plan. U.S. NEOs hired prior to January 1, 2005 are eligible to participate in the Pitney Bowes Pension Plan which is a broad-based tax-qualified plan under which employees generally are eligible to retire with unreduced benefits at age 65. U.S. NEOs who participate in the Pitney Bowes Pension Plan are also eligible to participate in the Pension Restoration Plan, a nonqualified deferred compensation plan, which provides benefits based on the same formula used under the qualified plan to eligible employees with compensation greater than the $260,000 IRC compensation limit for 2014 and to those employees who defer portions of their compensation under the Deferred Incentive Savings Plan.
The Pension Restoration Plan is offered to approximately 175 of our current active employees. Benefits under the Pension Restoration Plan are substantially equal to the difference between the amount that would have been payable under our qualified Pension Plan, absent IRS limits on compensation and benefits, and the amount actually paid under our qualified Pension Plan. Payments under the nonqualified Pension Restoration Plan are made out of the company’s general assets. The Pension Restoration Plan does not provide above-market interest rates on deferred compensation.
All of the eligible NEOs are fully vested in their pension benefit.
As previously approved by the board of directors, the qualified Pension Plan and nonqualified Pension Restoration Plan were frozen for all participants, effective December 31, 2014. There will beare no further accruals under the qualified Pension Plan or the nonqualified Pension Restoration Plan, except as required by law. (See discussion under “Other Indirect Compensation” on page 4845 of this proxy statement.) Mr. Monahan is the only pension eligible NEO and is fully vested in his pension benefit.
The following table provides information regarding the present value of accumulative pension benefits. It includes data regarding the Pitney Bowes Pension Plan and the Pension Restoration Plan. The Pitney Bowes Pension Plan which is a broad-based tax-qualified plan under which employees hired prior to January 1, 2005 are generally eligible to retire with unreduced benefits at age 65. The Pension Restoration Plan is a nonqualified deferred compensation plan, which provides benefits to employees with compensation greater than the $265,000 IRC compensation limit for 2016 who participate in the qualified Pension Plan, and to those employees who defer portions of their compensation under the Deferred Incentive Savings Plan. The Pension Restoration Plan mirrors the formula in the qualified Pension Plan and does not provide above-market interest rates on deferred compensation.
The amounts reported in the table below equal the present value of the accumulated benefit on December 31, 2014,2016, for the NEOsonly eligible NEO under the Pitney Bowes pension plans determined based on years of service and covered earnings (as described below). The present value has been calculated based on benefits payable commencing upon the executive attaining age 65, and in an amount consistent with the assumptions as described in note 1312 to the financial statements included in the Annual Report on Form 10-K for the year ended December 31, 2014,2016, as filed with the SEC on February 20, 2015.22, 2017.
EXECUTIVE COMPENSATION TABLES AND RELATED NARRATIVE
PENSION BENEFITS AS OF DECEMBER 31, 20142016(1)
| Number of Years | Present Value of | Number of Years | Present Value of | ||||||||
| Name | Plan Name | Credited Service (#) | Accumulated Benefit ($)(2) | Plan Name | Credited Service (#) | Accumulated Benefit ($)(2) | |||||
| Michael Monahan | Pitney Bowes Pension Plan | 26.6 | 368,113 | Pitney Bowes Pension Plan | 26.6 | 399,290 | |||||
| Michael Monahan | Pitney Bowes Pension Restoration Plan | 26.6 | 1,432,248 | ||||||||
| Daniel J. Goldstein | Pitney Bowes Pension Plan | 8.9 | 112,687 | ||||||||
| Daniel J. Goldstein | Pitney Bowes Pension Restoration Plan | 8.9 | 78,846 | ||||||||
| Pitney Bowes Pension Restoration Plan | 26.6 | 1,553,574 | |||||||||
| (1) | Mr. |
| benefit. | |
| (2) | Material assumptions used to calculate the present value of accumulated benefits under the Pitney Bowes Pension Plan |
The material terms of the Pitney Bowes Pension Plan and Pension Restoration Plan are as follows:
| • | ||
| • | Normal retirement age is 65 with at least three years of service, while early retirement is allowed at age 55 with at least ten years of service. | |
| • | The vesting period is three years. | |
| • | ||
| • | The formula to determine benefits is generally based on age, years of service, and final average of the five highest consecutive | |
| • | The maximum benefit accrual under the Pitney Bowes Pension Restoration Plan is an amount equal to 16.5% multiplied by the participant’s final average earnings and further multiplied by the participant’s credited service. | |
| • | Upon retirement, benefits are payable in a lump-sum or various annuity forms, including life annuity and 50% joint and survivor annuity. | |
| • | The distribution options under the Pitney Bowes Pension Restoration Plan are designed to comply with the requirements of IRC 409A of the Code. | |
| • | ||
Deferred Compensation
Information included in the following table below includes contributions, earnings, withdrawals, and balances with respect to the Pitney Bowes 401(k) Restoration Plan, (aa nonqualified deferred compensation plan restoring benefits that would have otherwise been made in the qualified 401(k) Plan but for IRC limitations)limitations, and the Pitney Bowes Deferred Incentive Savings Plan (a(DISP), a nonqualified deferred compensation plan where certain employees may defer their incentives and base salary).salary. The Pitney Bowes 401(k) Restoration Plan and Deferred Incentive Savings Plan, which we refer to as the DISP are unfunded plans established for a select group of management or highly compensated employees under ERISA. All payments pursuant to the plans are made from the general assets of the company and are subject to the company’s creditors. Participants do not own any interest in the assets of the company as a result of participating in the plans. The company reserves the right to fund a grantor trust to assist in accumulating funds to pay the company’s obligations under the plans. Any assets of the grantor trusts are subject to the claims of the company’s creditors.
Beginning with RSU and PSU awards made in February 2015, executivesExecutives who are required to own certain levels of company stock under the executive stock ownership policy may elect to defer the settlement of RSUs and PSUs upon vesting until the executives terminate employment or retire. Executives who choose to defer in this manner receive dividend equivalents once the award vests, which are also deferred as RSUs. Deferred RSUs and PSUs are unfunded deferred compensation subject to the company’s general creditors.
EXECUTIVE COMPENSATION TABLES AND RELATED NARRATIVE
NONQUALIFIED DEFERRED COMPENSATION FOR 2014(1)2016
| Executive | Registrant | Aggregate | Aggregate | Aggregate | ||||||||||||
| Contributions | Contributions | Earnings/(Loss) | Withdrawals/ | Balance at | ||||||||||||
| Name | in Last FY ($)(2) | in Last FY ($)(3) | in Last FY ($)(4) | Distributions ($) | Last FYE ($) | (5) | ||||||||||
| Marc B. Lautenbach | ||||||||||||||||
| 401(k) Restoration Plan | — | 3,705 | 156 | 0 | 3,861 | |||||||||||
| Deferred Incentive Savings Plan | 60,499 | — | (2,428 | ) | 0 | 58,071 | ||||||||||
| Michael Monahan | ||||||||||||||||
| 401(k) Restoration Plan | — | 24,782 | 10,800 | 0 | 229,217 | |||||||||||
| Deferred Incentive Savings Plan | — | — | 54,486 | 0 | 1,219,220 | |||||||||||
| Mark L. Shearer | ||||||||||||||||
| 401(k) Restoration Plan | — | — | — | 0 | — | |||||||||||
| Deferred Incentive Savings Plan | 24,309 | — | 935 | 0 | 25,244 | |||||||||||
| Abby F. Kohnstamm | ||||||||||||||||
| 401(k) Restoration Plan | — | — | — | 0 | — | |||||||||||
| Deferred Incentive Savings Plan | — | — | — | 0 | — | |||||||||||
| Daniel J. Goldstein | ||||||||||||||||
| 401(k) Restoration Plan | — | 24,343 | 4,063 | 0 | 80,378 | |||||||||||
| Deferred Incentive Savings Plan | — | — | 7,128 | 0 | 129,133 | |||||||||||
| Executive | Registrant | Aggregate | Aggregate | Aggregate | |||||||||||
| Contributions | Contributions | Earnings/(Loss) | Withdrawals/ | Balance at | |||||||||||
| Name | in Last FY ($)(1) | in Last FY ($)(2) | in Last FY ($)(3) | Distributions ($) | Last FYE ($)(4) | ||||||||||
| Marc B. Lautenbach | |||||||||||||||
| 401(k) Restoration Plan | — | 131,798 | 16,735 | 0 | 259,627 | ||||||||||
| Deferred Incentive Savings Plan | 43,862 | — | (11,080 | ) | 0 | 159,979 | |||||||||
| Michael Monahan | |||||||||||||||
| 401(k) Restoration Plan | — | 57,006 | (21,866 | ) | 0 | 264,142 | |||||||||
| Deferred Incentive Savings Plan | 50,000 | — | 129,336 | 0 | 1,404,836 | ||||||||||
| Mark L. Shearer | |||||||||||||||
| 401(k) Restoration Plan | — | 53,297 | 4,959 | 0 | 83,116 | ||||||||||
| Deferred Incentive Savings Plan | 13,294 | — | 5,438 | 0 | 71,533 | ||||||||||
| Robert Guidotti(5) | |||||||||||||||
| 401(k) Restoration Plan | — | — | — | 0 | — | ||||||||||
| Deferred Incentive Savings Plan | — | — | — | 0 | — | ||||||||||
| Roger Pilc | |||||||||||||||
| 401(k) Restoration Plan | — | 24,287 | 2,023 | 0 | 30,971 | ||||||||||
| Deferred Incentive Savings Plan | — | — | — | 0 | — | ||||||||||
| Mark F. Wright | |||||||||||||||
| 401(k) Restoration Plan | — | 19,401 | 1,686 | 0 | 28,526 | ||||||||||
| Deferred Incentive Savings Plan | — | — | — | 0 | — | ||||||||||
| (1) | ||
| Amounts in this column represent the portion of the annual incentives earned in | ||
| Amounts shown are company contributions to the Pitney Bowes 401(k) Restoration Plan earned in | ||
| Amounts shown are the respective earnings or losses in the Pitney Bowes 401(k) Restoration Plan and the Deferred Incentive Savings Plan. These earnings or losses are not included in the Summary Compensation Table. | ||
| Amounts shown are the respective balances in the Pitney Bowes 401(k) Restoration Plan and the Deferred Incentive Savings Plan. | ||
| (5) | Mr. Guidotti did not incur activity in the nonqualified deferred compensation plans in 2016. |
The material terms of the Pitney Bowes 401(k) Restoration Plan are as follows:
| • | The goal of this plan is generally to restore benefits that would have been provided under the qualified 401(k) Plan but for certain IRC limitations placed on tax-qualified 401(k) plans. | |
| • | For purposes of determining benefits under the 401(k) Restoration Plan, earnings are defined in the same manner as the qualified 401(k) Plan. Earnings include base salary, vacation, annual incentives (paid and deferred), and certain | |
| • | Participants need to contribute the allowable maximum pre-tax contributions to the 401(k) Plan to be eligible for any company match in the 401(k) Restoration Plan. Once the pre-tax maximum is contributed by the participant into the qualified 401(k) Plan, the company will match the same percentage of eligible compensation that the Participant defers under the 401(k) Plan and the DISP up to a maximum 4% of eligible compensation. | |
| • | ||
| • | ||
| • |
The material terms of the Deferred Incentive Savings Plan (DISP) are as follows:
EXECUTIVE COMPENSATION TABLES AND RELATED NARRATIVE
| • | ||
| • | Distributions from the DISP can occur for various reasons and will be in compliance with guidelines established under IRC 409A |
| 61 |
EXECUTIVE COMPENSATION TABLES AND RELATED NARRATIVE
| • | Termination/Death/Disability – a lump sum payment is made one month after termination including termination for disability and within 90 days after death | |
| • | Retirement – payment is made in accordance with the payment election in effect for the account beginning after termination | |
| • | Change of Control – payment is made in a lump sum in the event of a termination within two years following a Change of Control | |
| • | ||
Investment options for both the Pitney Bowes 401(k) Restoration Plan and the DISP are comparable to those in the qualified Pitney Bowes 401(k) Plan. These investment options provide participants with an opportunity to invest inPlan including a variety of publicly available bond funds, money market funds, equity funds, and blended funds, includingand Pitney Bowes stock. Each employee notionally selects his or her investment options and can change these at any time by accessing his or her account on the web site of the third party administrator. These investments are tracked in “phantom” accounts. All investment gains and losses in a participant’s account under the Pitney Bowes 401(k) Restoration Plan and the DISP are entirely based upon the notional investment selections made by the participant.
Potential Payments upon Termination or Change of Control
Other Post-Termination Payments
The following table reflects the amount of compensation that would become payable to each of the NEOs under existing arrangements if the hypothetical termination of employment events described had occurred on December 31, 2014,2016, given the NEO’s compensation and service levels as of such date and, if applicable, based on the company’s closing stock price on that date.
For purposes of valuing stock options in the “Post-Termination Payments” tables, we assume that upon a Change of Control, all vested outstanding stock options will be cashed out using the difference between the stock option exercise price and $24.37,$15.19, the closing price of our common stock onas of December 31, 2014.2016.
All payments are payable by the company in a lump-sum unless otherwise noted. The actual amounts that would be paid upon a NEO’s termination of employment can be determined only at the time of such executive’s separation from the company.Company. Due to the number of factors that affect the nature and amount of any benefits provided upon the events discussed below, any actual amounts paid or distributed may be higher or lower than reported in the tables below. Factors that could affect these amounts include the timing during the year of any such event, our company’s stock price and the executive’s age.
In the event of termination of employment, the NEOs are entitled to receive the vested portion of their deferred compensation account. The account balances continue to be credited with increases or decreases reflecting changes in the value of the investment funds that are tracked until the valuation date as provided under the plan, and therefore amounts received by the NEOs will differ from those shown in the “Nonqualified Deferred Compensation for 2014”2016” table on page 65.61. See the narrative accompanying that table for information on available types of distributions under the plans.
The benefits described in the following table are in addition to benefits available regardless of the occurrence of such an event, such as currently exercisable stock options, and benefits generally available to salaried employees, such as distributions under the company’s 401(k) Plan, subsidized retiree medical benefits, disability benefits, and accrued vacation pay. In addition, in connection with any actual termination of employment, the Committee, or in the case of Messrs. Lautenbach and Monahan, the independent board members, may determine to enter into an agreement or to establish an arrangement providing additional benefits or amounts, or altering the terms of benefits described in the tables below, as the Committee determines appropriate or in the case of Mr. Lautenbach, the independent board members.appropriate.
EXECUTIVE COMPENSATION TABLES AND RELATED NARRATIVE
Estimated Post-Termination Payments and Benefits(1)
| Change of | Change of | ||||||||||||||||||||||||||||||||||||||
| Control with | Control with | ||||||||||||||||||||||||||||||||||||||
| Retirement | Involuntary Not for | Termination | Retirement | Involuntary Not for | Termination | ||||||||||||||||||||||||||||||||||
| Name | Type of Payment or Benefit | Eligible ($) | Cause Termination ($)(2) | (CIC) ($) | Death ($) | Disability ($) | Type of Payment or Benefit | Eligible ($) | Cause Termination ($)(2) | (CIC) ($) | Death ($) | Disability ($) | |||||||||||||||||||||||||||
| Marc B. Lautenbach | Severance | — | 34,615 - 3,172,500 | (3) | 4,230,000 | (4) | — | — | Severance | — | 36,538 - 3,348,750 | (3) | 4,207,310 | )(4) | — | — | |||||||||||||||||||||||
| Annual Incentive | — | 0 - 1,215,000 | (5) | 1,215,000 | (6) | 1,519,965 | (7) | 1,519,965 | (7) | Annual Incentive | — | 0 - 0 | (5) | 1,282,500 | (6) | 0 | (7) | 0 | (7) | ||||||||||||||||||||
| CIUs | Stock Options Accelerated(8) | — | 0 - 0 | 0 | 0 | 0 | |||||||||||||||||||||||||||||||||
| 2013 – 2015 cycle | — | 0 - 1,600,000 | (8) | 2,400,000 | (9) | 1,600,000 | (8) | 1,600,000 | (8) | Performance-based RSUs Accelerated(9) | — | 0 - 1,382,320 | 2,375,716 | 2,375,716 | 2,375,716 | ||||||||||||||||||||||||
| Stock Options Accelerated(10) | — | 0 - 3,038,800 | 3,038,800 | 3,038,800 | 3,038,800 | Performance Stock Units | |||||||||||||||||||||||||||||||||
| Performance-based RSUs Accelerated(11) | — | 0 - 1,407,636 | 3,423,766 | 3,423,766 | 3,423,766 | 2014 – 2016 cycle | — | 0 - 1,067,111 | (10) | 1,067,111 | (11) | 1,067,111 | (10) | 1,067,111 | (10) | ||||||||||||||||||||||||
| Performance Stock Units | 2015 – 2017 cycle | — | 0 - 1,666,353 | (12) | 2,499,530 | (13) | 1,666,353 | (12) | 1,666,353 | (12) | |||||||||||||||||||||||||||||
| 2014 – 2016 cycle | — | 0 | (12) | 3,057,168 | (13) | 1,019,056 | (12) | 1,019,056 | (12) | 2016 – 2018 cycle | — | 0 | (12) | 2,980,202 | (13) | 993,401 | (12) | 993,401 | (12) | ||||||||||||||||||||
| Financial Counseling(14) | — | 0 - 11,250 | — | — | — | Financial Counseling(14) | — | 0 - 20,250 | — | — | — | ||||||||||||||||||||||||||||
| Medical & other benefits(15) | — | — | 78,298 | Medical & other benefits(15) | — | — | 77,252 | — | — | ||||||||||||||||||||||||||||||
| Total | 0 | 34,615 - 10,445,186 | 17,443,032 | 10,601,587 | 10,601,587 | Total | 0 | 1,702,892 - 7,484,784 | 14,489,622 | 6,102,581 | 6,102,581 | ||||||||||||||||||||||||||||
| Michael Monahan | Severance | — | 23,358 - 1,639,764 | (3) | 2,043,382 | (4) | — | — | Severance | — | 24,540 - 1,818,445 | (3) | 2,233,026 | (4) | — | — | |||||||||||||||||||||||
| Annual Incentive | — | 485,856 | (5) | 485,856 | (6) | 607,806 | (7) | 607,806 | (7) | Annual Incentive | 0 | (7) | 0 | (5) | 574,246 | (6) | 0 | (7) | 0 | (7) | |||||||||||||||||||
| CIUs | Stock Options Accelerated(8) | 0 | 0 | 0 | 0 | 0 | |||||||||||||||||||||||||||||||||
| 2012 – 2014 cycle | — | 864,500 | (16) | 864,500 | (9) | 864,500 | (16) | 864,500 | (16) | Performance-based RSUs | |||||||||||||||||||||||||||||
| 2013 – 2015 cycle | — | 520,000 | (8) | 780,000 | (9) | 520,000 | (8) | 520,000 | (8) | Accelerated(9) | 489,726 | 850,959 | 850,959 | 850,959 | 850,959 | ||||||||||||||||||||||||
| Stock Options Accelerated(10) | — | 713,860 | 1,070,800 | 1,070,800 | 1,070,800 | Performance Stock Units | |||||||||||||||||||||||||||||||||
| Performance-based RSUs Accelerated(11) | — | 976,457 | 1,355,557 | 1,355,557 | 1,355,557 | 2014 – 2016 cycle | 308,280 | (10) | 308,280 | (10) | 308,280 | (11) | 308,280 | (10) | 308,280 | (10) | |||||||||||||||||||||||
| Performance-based MSUs Accelerated(11) | — | 442,218 | 442,218 | 442,218 | 442,218 | 2015 – 2017 cycle | 666,537 | (12) | 666,537 | (12) | 999,806 | (13) | 666,537 | (12) | 666,537 | (12) | |||||||||||||||||||||||
| Performance Stock Units | 2016 – 2018 cycle | 361,238 | (12) | 361,238 | (12) | 1,083,715 | (13) | 361,238 | (12) | 361,238 | (12) | ||||||||||||||||||||||||||||
| 2014 – 2016 cycle | — | 294,398 | (12) | 883,193 | (13) | 294,398 | (12) | 294,398 | (12) | Incremental Pension Benefit | — | 106,912 | (16) | 0 | (16) | — | — | ||||||||||||||||||||||
| Incremental Pension Benefit | — | 0 | (17) | 0 | (17) | — | — | Financial Counseling(14) | — | 20,250 | — | — | — | ||||||||||||||||||||||||||
| Financial Counseling(14) | — | 11,250 | — | — | — | Medical & other benefits(15) | — | — | 81,348 | — | — | ||||||||||||||||||||||||||||
| Medical & other benefits(15) | — | — | 79,340 | — | — | Total | 1,825,782 | 1,977,479 - 4,132,622 | 6,131,380 | 2,187,015 | 2,187,015 | ||||||||||||||||||||||||||||
| Total | 0 | 4,331,897 - 5,948,303 | 8,004,846 | 5,155,279 | 5,155,279 | ||||||||||||||||||||||||||||||||||
| Mark L. Shearer | Severance | — | 21,987 - 1,543,455 | (3) | 2,115,660 | (4) | — | — | Severance | — | 22,426 - 1,574,324 | (3) | 1,783,310 | (4) | — | — | |||||||||||||||||||||||
| Annual Incentive | — | 0 - 457,320 | (5) | 457,320 | (6) | 572,107 | (7) | 572,107 | (7) | Annual Incentive | — | 0 - 0 | (5) | 466,466 | (6) | 0 | (7) | 0 | (7) | ||||||||||||||||||||
| CIUs | Stock Options Accelerated(8) | — | 0 - 0 | 0 | 0 | 0 | |||||||||||||||||||||||||||||||||
| 2013 – 2015 cycle | — | 0 - 520,000 | (8) | 780,000 | (9) | 520,000 | (8) | 520,000 | (8) | Performance-based RSUs Accelerated(9) | — | 0 - 391,507 | 626,314 | 626,314 | 626,314 | ||||||||||||||||||||||||
| Performance-based RSUs Accelerated(11) | — | 0 - 443,705 | 1,044,669 | 1,044,669 | 1,044,669 | Performance Stock Units | |||||||||||||||||||||||||||||||||
| Performance Stock Units | 2014 – 2016 cycle | — | 0 - 308,280 | (10) | 308,280 | (11) | 308,280 | (10) | 308,280 | (10) | |||||||||||||||||||||||||||||
| 2014 – 2016 cycle | — | 0 | (12) | 883,193 | (13) | 294,398 | (12) | 294,398 | (12) | 2015 – 2017 cycle | — | 0 - 433,249 | (12) | 649,874 | (13) | 433,249 | (12) | 433,249 | (12) | ||||||||||||||||||||
| Financial Counseling(14) | — | 0 - 11,250 | — | — | — | 2016 – 2018 cycle | — | 0 | (12) | 704,406 | (13) | 234,802 | (12) | 234,802 | (12) | ||||||||||||||||||||||||
| Medical & other benefits(15) | — | 0 | 61,040 | — | — | Financial Counseling(14) | — | 0 - 20,250 | — | — | — | ||||||||||||||||||||||||||||
| Total | 0 | 21,987 - 2,975,730 | 5,341,882 | 2,431,174 | 2,431,174 | Medical & other benefits(15) | — | 0 | 61,396 | — | — | ||||||||||||||||||||||||||||
| Abby F. Kohnstamm | Severance | — | 21,538 - 1,512,000 | (3) | 2,102,644 | (4) | — | — | |||||||||||||||||||||||||||||||
| Total | 0 | 455,675 - 2,727,611 | 4,600,047 | 1,602,646 | 1,602,646 | ||||||||||||||||||||||||||||||||||
| Robert Guidotti | Severance | — | 20,385 - 1,272,000 | (3) | 1,042,429 | (4) | — | — | |||||||||||||||||||||||||||||||
| Annual Incentive | — | 0 - 448,000 | (5) | 448,000 | (6) | 560,448 | (7) | 560,448 | (7) | Annual Incentive | — | 0 - 0 | (5) | 318,000 | (6) | 0 | (7) | 0 | (7) | ||||||||||||||||||||
| Performance-based RSUs Accelerated(11) | — | 0 | 534,629 | 534,629 | 534,629 | Stock Options Accelerated(8) | — | 0 - 0 | 0 | 0 | 0 | ||||||||||||||||||||||||||||
| Performance Stock Units | Performance-based RSUs Accelerated(9) | — | 0 - 0 | 153,525 | 153,525 | 153,525 | |||||||||||||||||||||||||||||||||
| 2014 – 2016 cycle | — | 0 | (12) | 339,693 | (13) | 113,231 | (12) | 113,231 | (12) | Performance Stock Units | |||||||||||||||||||||||||||||
| Financial Counseling(14) | — | 0 - 11,250 | — | — | — | 2016 – 2018 cycle | — | 0 | (12) | 460,576 | (13) | 153,525 | (12) | 153,525 | (12) | ||||||||||||||||||||||||
| Medical & other benefits(15) | — | — | 50,888 | — | — | Financial Counseling(14) | — | 0 - 20,250 | — | — | — | ||||||||||||||||||||||||||||
| Total | 0 | 21,538 - 1,971,250 | 3,475,854 | 1,208,308 | 1,208,308 | Medical & other benefits(15) | — | 0 | 69,930 | — | — | ||||||||||||||||||||||||||||
| Daniel J. Goldstein | Severance | — | 18,912 - 1,180,133 | (3) | 1,131,177 | (4) | — | — | |||||||||||||||||||||||||||||||
| Total | 0 | 20,385 - 1,292,250 | 2,044,460 | 307,051 | 307,051 | ||||||||||||||||||||||||||||||||||
| Roger Pilc | Severance | — | 18,896 - 1,179,120 | (3) | 1,373,651 | (4) | — | — | |||||||||||||||||||||||||||||||
| Annual Incentive | — | 295,033 | (5) | 295,033 | (6) | 369,087 | (7) | 369,087 | (7) | Annual Incentive | — | 0 - 0 | (5) | 294,780 | (6) | 0 | (7) | 0 | (7) | ||||||||||||||||||||
| CIUs | Stock Options Accelerated(8) | — | 0 - 0 | 0 | 0 | 0 | |||||||||||||||||||||||||||||||||
| 2012 – 2014 cycle | — | 432,250 | (16) | 432,250 | (9) | 432,250 | (16) | 432,250 | (16) | Performance-based RSUs Accelerated(9) | — | 0 -163,384 | 316,909 | 316,909 | 316,909 | ||||||||||||||||||||||||
| 2013 – 2015 cycle | — | 260,000 | (8) | 390,000 | (9) | 260,000 | (8) | 260,000 | (8) | Performance Stock Units | |||||||||||||||||||||||||||||
| Stock Options Accelerated(10) | — | 0 | 0 | 0 | 0 | 2014 – 2016 cycle | — | 0 - 118,571 | (10) | 118,571 | (11) | 118,571 | (10) | 118,571 | (10) | ||||||||||||||||||||||||
| Performance-based RSUs Accelerated(11) | — | 368,011 | 671,930 | 671,930 | 671,930 | 2015 – 2017 cycle | — | 0 - 199,961 | (12) | 299,942 | (13) | 199,961 | (12) | 199,961 | (12) | ||||||||||||||||||||||||
| Performance-based MSUs Accelerated(11) | — | 221,109 | 221,109 | 221,109 | 221,109 | 2016 – 2018 cycle | — | 0 | (12) | 460,576 | (13) | 153,525 | (12) | 153,525 | (12) | ||||||||||||||||||||||||
| Performance Stock Units | Financial Counseling(14) | — | 0 - 20,250 | — | — | — | |||||||||||||||||||||||||||||||||
| 2014 – 2016 cycle | — | 147,195 | (12) | 441,584 | (13) | 147,195 | (12) | 147,195 | (12) | Medical & other benefits(15) | — | 0 | 77,878 | — | — | ||||||||||||||||||||||||
| Incremental Pension Benefit | — | 7,348 | (17) | 0 | (17) | — | — | Total | 0 | 218,857 - 1,681,286 | 2,942,306 | 788,966 | 788,966 | ||||||||||||||||||||||||||
| Financial Counseling(14) | — | 11,250 | — | — | — | ||||||||||||||||||||||||||||||||||
| Medical & other benefits(15) | — | — | 50,988 | — | — | ||||||||||||||||||||||||||||||||||
| Total | 0 | 1,761,109 - 2,922,329 | 3,634,071 | 2,101,571 | 2,101,571 | ||||||||||||||||||||||||||||||||||
| (1) | All data is shown assuming termination on December 31, |
| (2) | Ranges represent variance between the |
| (3) | If termination of employment falls within the terms of the Pitney Bowes Severance Pay Plan, the named executive officers would receive a minimum of 2 weeks of base salary if they were terminated involuntarily and not for cause. Under our enhanced severance policy, the |
EXECUTIVE COMPENSATION TABLES AND RELATED NARRATIVE
| (4) | The |
| 63 |
EXECUTIVE COMPENSATION TABLES AND RELATED NARRATIVE
| (5) | A prorated annual incentive is paid at the lower of target or current bonus accrual as additional severance at termination contingent upon signing a waiver and release. If a waiver and release is not signed, no severance is paid in excess of two weeks. |
| (6) | Annual incentive is valued at the targeted amount and is paid upon termination following a change of control. |
| (7) | A prorated annual incentive is paid at the actual amount earned for |
| (8) | |
| In the case of retirement, options outstanding for at least one year will immediately vest and remain exercisable for the balance of the option term. In the case of involuntary not for cause termination, options outstanding for at least one year will continue to vest and remain exercisable for 24 months following termination of employment contingent upon signing a waiver and release. In the case of retirement or involuntary not for cause termination, options outstanding for less than one year forfeit. In the cases of change of control, death and disability, all outstanding options will immediately vest and remain exercisable for the balance of the option term. | |
| In the case of involuntary not for cause termination accompanied by a separation agreement including a waiver and release, all performance-based RSUs | |
| (10) | PSUs for the 2014-2016 cycle are vested at 0.56 per unit based upon actual achievement of performance metrics for the 2014-2016 cycle. In the case of involuntary not for cause termination, payment of this amount is subject to signing a waiver and release. If the executive has attained retirement eligibility or is bridgeable to early retirement, then vesting is prorated based upon time worked through the end of the cycle. This amount was vested in February 2017 under the normal vesting of PSUs. |
| (11) | PSUs for 2014 - 2016 cycle are vested at 0.56 per unit in February, 2017 under the normal vesting of PSUs. |
| (12) | PSUs for the |
| (13) | PSUs for the |
| (14) | Amount shown is the value of the |
| (15) | Amount shown is the present value of the |
| (16) | |
| Amount shown is the increase in lump-sum actuarial equivalent of the pension age, service and earnings credits for the associated severance period. Mr. |
EXECUTIVE COMPENSATION TABLES AND RELATED NARRATIVE
Explanation of Benefits Payable upon Various Termination Events
The benefits described below apply to the NEOs.
Resignation
A voluntary termination would not provide any compensation, benefits or special treatment under equity plans for any of the NEOs.
Early and Normal Retirement
The U.S. Pitney Bowes Pension Plan allows for early retirement at age 55 with at least ten years of service, and normal retirement at age 65 with at least three years of service. The early and normal retirement rules established under the Pension Plan are also utilized under the long-term incentive plan and stock plan for special vesting purposes. NEOs meeting the requirements specified for early or normal retirement are entitled to the following upon termination:
| • | A prorated annual incentive award; | |
| • | Prorated PSU | |
| • | Stock option awards and RSUs that have been outstanding for at least one year will fully vest upon retirement and stock options will remain exercisable for the duration of the | |
Involuntary/Not for Cause Termination – Severance Pay Plan
We maintain a severance pay plan that provides for the payment of severanceseparation pay to full-time employees based in the United States whose employment is terminated under certain business circumstances (other than a Change of Control). The Pitney Bowes Severance Pay Plan provides a continuation of compensation upon involuntary termination by the company without cause as summarized below. In order to obtain an appropriate waiver and release from the employee, we may offer conditional severance payments. Where an employee is involuntarily terminated after becoming eligible for early retirement, the employee is eligible for benefits afforded early retirees or involuntarily terminated employees, whichever is greater.
The Severance Pay Plan provides for one week of salary continuation benefits per year of service.service with a two-week minimum benefit. Salary continuation benefits in excess of two weeks of salary require a signed agreement containing a waiver and release. There is a two week minimum benefit under the Severance Pay Plan.
We may offer additional severancebenefits to employees, including NEOs, upon termination of employment, conditioned upon signing a waiver and release. Additional severancebenefits could include the following payments:
| • | ||
| • | A prorated annual incentive award to the date of termination of employment; | |
| • | PSUs outstanding for one year from the date of grant are prorated, | |
| • | For NEOs, stock options | |
| • | The board of directors has the discretion to accelerate vesting of restricted stock, RSUs | |
| • | Financial counseling through the severance period; and | |
| • | Outplacement services. |
EXECUTIVE COMPENSATION TABLES AND RELATED NARRATIVE
Termination for Cause
Termination for cause would not provide any additional compensation, severance, benefits or special treatment under equity plans to any of the NEOs. “Cause” is defined as willful failure to perform duties or engaging in illegal conduct or gross misconduct harmful to the company.
| 65 |
EXECUTIVE COMPENSATION TABLES AND RELATED NARRATIVE
Death
The NEO’s beneficiary would be entitled to the following upon the executive’s death:
| • | A prorated annual incentive award; | |
| • | PSUs are prorated through the date of death and vested, valued and converted into stock at the end of each three-year cycle; | |
| • | ||
| All stock options will vest upon death. The NEO’s beneficiary can exercise stock options during the remaining term of the grant; | ||
| • | ||
Disability
Disability vesting occurs after the completion of two years of long-term disability or on the date of termination of employment due to disability, whichever is earlier. The NEOs would be entitled to the following upon termination for disability:
| • | A prorated annual incentive award; | |
| • | PSU are prorated through the date of disability and vested, valued and converted into stock at the end of each three-year cycle; | |
| • | ||
| All stock options and RSUs will vest upon disability vesting date (two years after the onset of LTD). Stock options can be exercised during the remaining term of the grant; | ||
Change of Control Arrangements
Set forth below is a summary of our Change of Control arrangements. Under our Change of Control arrangements, a “Change of Control” is defined as:
| • | an acquisition of 30% or more of our common stock or 30% or more of the combined voting power of our voting securities by an individual, entity or group; | |
| • | the replacement of a majority of the board of directors other than by approval of the incumbent board; | |
| • | the consummation of a reorganization, merger, or consolidation where greater than 50% of our common stock and voting power changes hands; or | |
| • | the approval by stockholders of the liquidation or dissolution of the company. |
Pitney Bowes does not gross-up the excise tax applicable to change of control payments. Upon a termination from employment without cause or for good reason (defined as a diminution in position, authority, duties, responsibilities, earnings or benefits, or relocation) within two years of a Change of Control each of the NEOs receive payments calculated based on a “best-net” approach as it relates to the benefits described below.
| • | Either (i) the full value of the payment equal to two times the sum of the participant’s current annual salary and the participant’s average annual incentive award in the preceding three years, or (ii) the value of the payment that is capped at the 280G limit, depending on which provides the higher after-tax benefit. | |
| • | ||
| • | PSU vesting based on the total of the outstanding grants for each of the open cycles at target number of shares at the end of the cycle, or upon termination, if earlier; | |
| • | ||
| All stock options, restricted stock |
EXECUTIVE COMPENSATION TABLES AND RELATED NARRATIVE
| • | Health and welfare benefits for the executive and his or her dependents will be provided for a two-year period; and | |
| • | Outplacement services. |
| 66 |
EXECUTIVE COMPENSATION TABLES AND RELATED NARRATIVE
Internal Revenue Code Section 409A
Our benefits arrangements are intended to comply with IRC 409A. In that regard, “Key Employees” as defined in IRC 409A and IRC 416 may have certain payments delayed until six months after termination of employment.
In addition to the use of the mail, proxies may be solicited by the directors, officers, and employees of the company without additional compensation by personal interview, by telephone, or by electronic transmission. Arrangements may also be made with brokerage firms and other custodians, nominees, and fiduciaries for the forwarding of solicitation material to the beneficial owners of Pitney Bowes common stock and $2.12 convertible preference stock held of record, and the company will reimburse such brokers, custodians, nominees, and fiduciaries for reasonable out-of-pocket expenses incurred. The company has retained Morrow & Co.,Sodali LLC to aid in the solicitation of proxies.
The anticipated fee of such firmfor Morrow Sodali’s services is $10,000 plus out-of-pocket costs and expenses. The cost of solicitation will be borne entirely by Pitney Bowes.
Management knows of no other matters which may be presented for consideration at the meeting. However, if any other matters properly come before the meeting, it is the intention of the individuals named in the enclosed proxy to vote in accordance with their judgment.
By order of the board of directors.
Amy C. Corn
Daniel J. Goldstein
Executive Vice President,
Chief Legal Officer and Corporate Secretary


This proxy statement is printed entirely on recycled and recyclable paper.
![]()

PITNEY BOWES INC.3001 SUMMER STREETC/O BROADRIDGE CORPORATE ISSUER SOLUTIONSSTAMFORD, CT 06926P.O. BOX 1342
BRENTWOOD, NY 11717
VOTE BY INTERNET -www.proxyvote.com
Use the Internet to transmit your voting instructions and for electronic delivery of information up until 11:59 p.m. Eastern Time the day before the cut-off date or meeting date.on May 7, 2017. Have your proxy card in hand when you access the web site and follow the instructions to obtain your records and to create an electronic voting instruction form.
ELECTRONIC DELIVERY OF FUTURE PROXY MATERIALS
If you would like to reduce the costs incurred by our company in mailing proxy materials, you can consent to receiving all future proxy statements, proxy cards and annual reports electronically via e-mail or the Internet. To sign up for electronic delivery, please follow the instructions above to vote using the Internet and, when prompted, indicate that you agree to receive or access proxy materials electronically in future years.
VOTE BY PHONE - 1-800-690-6903
Use any touch-tone telephone to transmit your voting instructions up until 11:59 p.m. Eastern Time the day before the cut-off date or meeting date.on May 7, 2017. Have your proxy card in hand when you call and then follow the instructions.
VOTE BY MAIL
Mark, sign and date your proxy card and return it in the postage-paid envelope we have provided or return it to Vote Processing, c/o Broadridge, 51 Mercedes Way, Edgewood, NY 11717.
TO VOTE, MARK BLOCKS BELOW IN BLUE OR BLACK INK AS FOLLOWS:
E20839-P88587 KEEP THIS PORTION FOR YOUR RECORDS
DETACH AND RETURN THIS PORTION ONLY
THIS PROXY CARD IS VALID ONLY WHEN SIGNED AND DATED.
PITNEY BOWES INC.
Please sign exactly as your name(s) appear(s) hereon. When signing as attorney, executor, administrator, or other fiduciary, please give full title as such. Joint owners should each sign personally. All holders must sign. If a corporation or partnership, please sign in full corporate or partnership name by authorized officer.
V.1.1
Upon arrival, please present this admission ticket and valid, government-issued
Important Notice Regarding the Availability of Proxy Materials for the Annual Meeting of Stockholders The Notice and Proxy Statement and Annual Report to Stockholders including the Report on Form
E20840-P88587
Proxy Solicited on Behalf of Pitney Bowes Board of Directors
Marc Lautenbach, Michael
The undersigned, if a participant in any of the Pitney Bowes 401(k) Plans (the “Plans”) for which T. Rowe Price Trust Company acts as directed Trustee (“Trustee”), hereby directs the Trustee to vote as indicated on the reverse side all Pitney Bowes common stock allocated to his or her account, as indicated on the reverse side, at the annual meeting of stockholders to be held in Old Greenwich, Connecticut, on May
Shown on this card are all shares of common stock and $2.12 convertible preference stock registered in your name, held for your benefit in the dividend reinvestment plan and/or held for your benefit in the Plans. The shares represented hereby will be voted in accordance with the directions given by the stockholder.If a properly signed proxy is returnedwithout choices marked, the shares represented by this proxy registered in your name and/or held for your benefit in the dividend reinvestment plan will be voted FOR each of the nominees listed in Proposal 1, FOR Items 2 and 3 and 1
In their discretion, the proxies are authorized to vote in accordance with their
Please mark, date, sign, and promptly return this proxy in the enclosed envelope, which requires no postage if mailed in the U.S., or grant your proxy via telephone or Internet as described on the reverse side.
Continued and to be signed on reverse side V.1.1 | |||||||||||||||||||||||||||||||||||||||||||||||||||||||||||||||||||||||||||||||||||||||||||||||||||||||||||||||||||||||||||||||||||||||||||||||||||||||||||||||||||||||||||||||||||||||||||||||||||||||||||||||||||||||||||||||||||||||||||||||||||||||||||||||||||||||||||||||||||||||||||||||||||||||||||||||||||||||||||||||||||||||||||||||||||||||||||||||||||||||||||||||||||||||||||||||||||||||||||||||||||||||||||||||||||||||||||||||||||||||||||||||||||||||||||||||||||||||||||||||||||||||||||||||||||||||||||||||||||||||||||||||||||||||||||||||||||||||||||||||||||||||||||||||||||||||||||||||||||||||||||||||||||||||||||||||||||||||||||||||||||||||||||||||||||||||||||||||||||||||||||||||||||||||||||||||||||||||||||||||||||||||||||||||||||||||||||||||||||||||||||||||||||||||||||||||||||||||||||||||||||||||||||||||||||||||||||||||||||||||||||||||||||||||||||||||||||||||||||||||||||||||||||||||||||||||||||||||||||||||||||||||||||||||||||||||||||||||||||||||||||||||||||||||||||||||||||||||||||||||